4 Crucial Credit Charts No Investor Should Ignore
 |
If you made it, great! If for any reason you couldn’t come, not to worry. In 2019, I’ll be heading to MoneyShow events in Las Vegas (May 13-15), Seattle (June 15-16), San Francisco (Aug. 15-17) and Philadelphia (Sept. 26-28). I’m also going to be participating in the 2019 Money, Metals & Mining Cruise (Dec. 6-14). Just go to the group’s website at https://www.moneyshow.com/conferences or call 800-970-4355 for details.
There were four crucial credit charts I discussed at the event. So crucial, in fact, that I’m going to share them here as well in case you missed them.
Three come from the Federal Reserve and its Senior Loan Officer Opinion Survey on Bank Lending Practices (“SLOOS” for short). One is from the American Bankers Association and its Consumer Credit Delinquency Bulletin.
Chart 1 shows the net percentage of banks' tightening standards on commercial and industrial (C&I) loans. In other words, it illustrates whether banks are generally getting more or less restrictive when it comes to making core business loans.
Chart #1
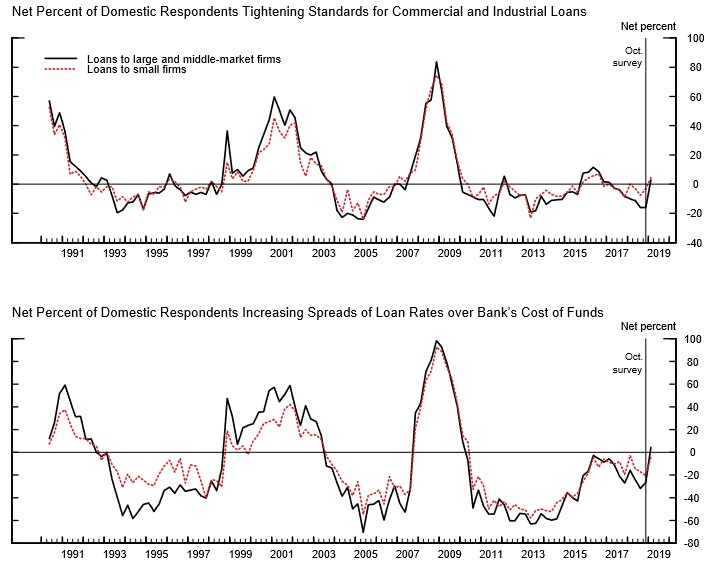 |
You can see that this reading spiked at the end of 2018. Excluding a short-term peak in 2016 that was driven by energy sector defaults, the index hasn’t been this high in almost six years.
But it’s not just the availability of business loans that’s increasingly becoming an issue. It’s their cost.
Chart 2 shows the net percentage of banks that are charging higher “spreads” over their cost of funds. In other words, when this index rises, it signals that banks are getting more worried about future defaults and are building in some extra interest-rate cushion to cover potential losses down the road.
You can see the index just spiked to its highest level since 2010 …
Chart #2
 |
Now so far, I’ve been focusing on the business-lending backdrop. But what about consumers? How are they faring, and are banks making it easier or harder for them to get loans?
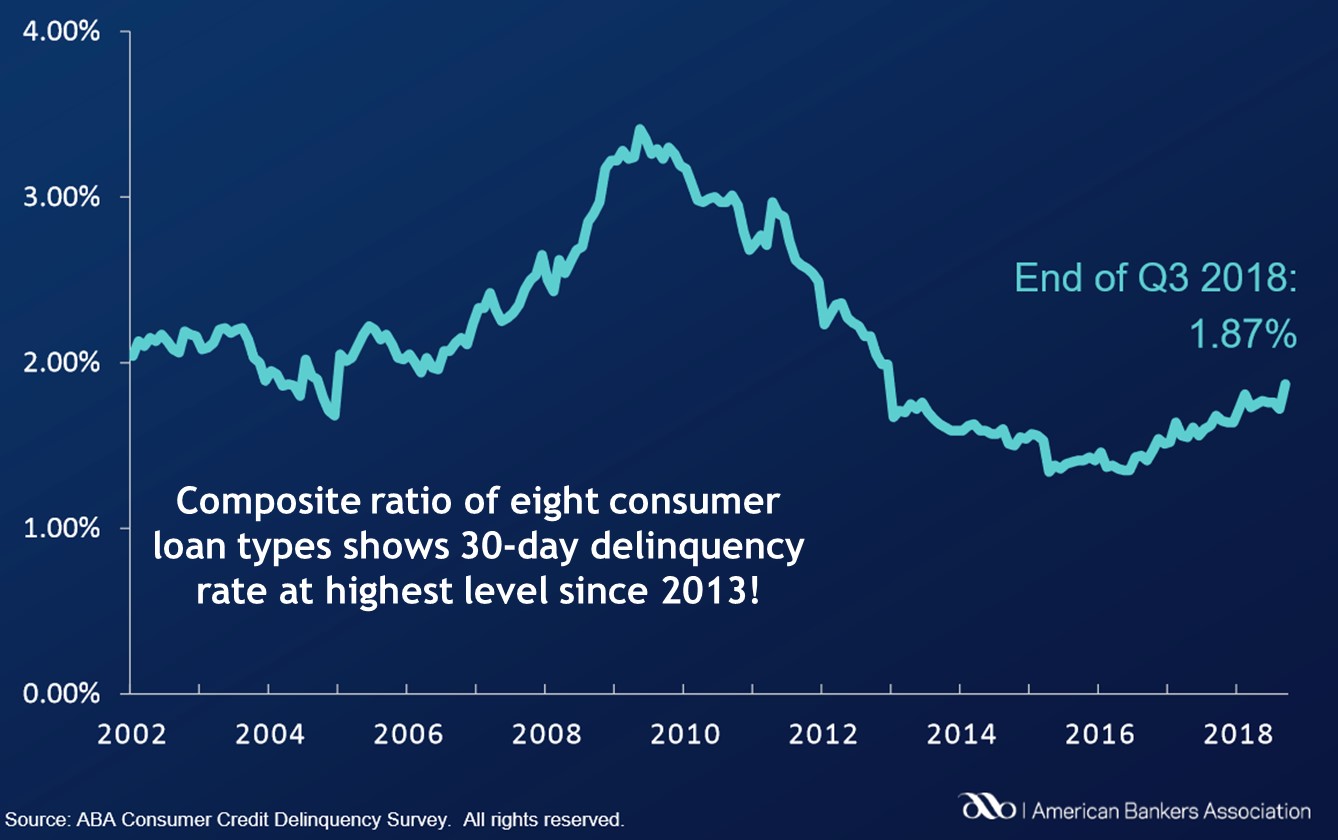
Chart 3 comes from the ABA, the banking trade group. It produces a composite ratio that tracks delinquencies on eight different types of consumer loans -- including everything from home-equity and auto loans to personal and RV loans.
You can see that in the third quarter of 2018, this ratio spiked to 1.87%. In plain English, that means more consumers are falling at least 30 days behind on their loan payments than at any time since 2013.
Chart #3
 |
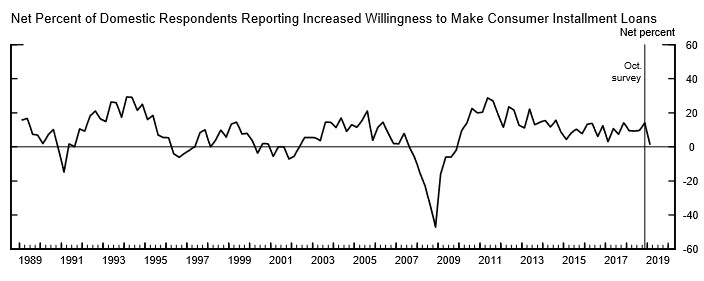
What happens when more borrowers miss payments on older loans? You guessed it: Banks get stingier making new loans.
That’s what Chart 4 shows. You can see the index that measures banks' willingness to make consumer loans just fell to its lowest level in almost nine years!
Chart #4
 |
So, why are charts like these so important for investors? Because credit is the lifeblood of our economy!
When business loans are plentiful and cheap, companies expand. They build more factories, buy more equipment, hire more workers and launch more new ventures.
When consumer loans are plentiful and cheap, Americans spend more. They buy larger homes, more expensive cars, or luxury items like boats and RVs.
But if banks and other lenders pull in their horns, activity slows. While policymakers can try to offset that by cutting interest rates or launching bond-buying programs, lenders have to take the cheap money and lend. If they don’t ... because they’re buried under rising delinquencies and defaults, for instance ... it won’t matter. The economy’s gears will grind to a halt.
We’ve seen precisely that cycle play out twice in the last two decades, once the two unsustainable bubbles in tech and housing popped.
Things aren’t that severe ... yet ... this time around. None of the four indices I shared with you are at the levels seen in the past two recessions.
But it’s their trajectory that counts.
They’re all confirming a turn in the credit cycle after several years of wild excesses on the borrowing and lending front.
My advice is therefore rather straightforward and simple: Continue to invest more defensively and prudently. Avoid vulnerable sectors like financials. Use downside hedges to protect against losses stemming from a tighter credit environment. And maintain higher cash levels than you did from 2009 through the start of 2018.
Most importantly, stay alert for more potential deterioration in these surveys. I know I’ll be keeping an eye on them because the stock market will be in major trouble if they weaken further.
Until next time,
Mike Larson