Markets Teetering on the Edge of Something Big, But What? And Why?
It’s been a while since our children were young enough to enjoy the playground. But as parents, we remember how much joy they got hanging from the monkey bars, swinging on the swings, and slipping down the slides.
But you also couldn’t help but worry, about serious injury.
We feel the same way about today’s markets. Volatility is rising. Key sectors are wobbling. We’re not getting the same kind of “V-shaped recoveries” we’ve seen repeatedly since the bull market began in 2009.
Indeed, our research suggests stocks are teetering on the edge of something big — potentially very big. All it would take is a gust of wind or random misstep, and the façade built up by nine years of funny money could come crashing down.
This is not idle fear-mongering. It’s a real possibility based on undeniable history.
The Tech Bubble and the Housing Bubble
In the past two decades, we’ve experienced two gigantic asset bubbles — first in tech stocks, then in housing.
Both were driven by unbridled financial engineering. Garbage IPOs like Pets.com or Webvan. No-asset, no-income mortgages issued by the likes of Washington Mutual or Countrywide Financial.
Both were fueled by over-the-top monetary policy.
And both were followed by two of the greatest crashes in modern history: The Tech Wreck of 2000-2003 and the Housing Bust of 2007-2009.
The big difference: Now, the bubble is larger, and the ensuing bust could pack a bigger wallop. To understand why, set aside fear and hope. Focus strictly on the facts:
Fact #1. To combat the early 1990s recession and S&L collapse, the U.S. Federal Reserve dropped the Fed Funds target down to a low of 3%. Then it kept it at that low for 17 months. The Fed also printed around $70 billion during the policy easing cycle, boosting the monetary base by 22%.
That was crazy. So crazy, in fact, it was a major factor that inflated the tech bubble that ended in the Tech Wreck.
Fact #2. To combat the Tech Wreck, the Fed slashed its benchmark rate from 6.5% to 1%, and kept it there for 12 months. They also printed $125 billion, boosting the monetary base 19%.
That was crazier. So much so that it helped create the biggest housing bubble ever, which ended in the worst housing bust, financial crisis and recession since the 1930s.
Fact #3. To rescue the economy from that disaster, the folks at the Fed went stark, raving mad. They shoved interest rates to the floor like a sumo wrestler. They sat on zero rates for 84 months. And they printed more than $3 trillion to, boosting the monetary base by 370%!
Fact #4. Federal debt is off the charts. It has exploded 3.5 times since the start of the millennium, from $5.7 trillion $20.2 trillion, with the lion’s share of that debt build-up coming in the last eight years.
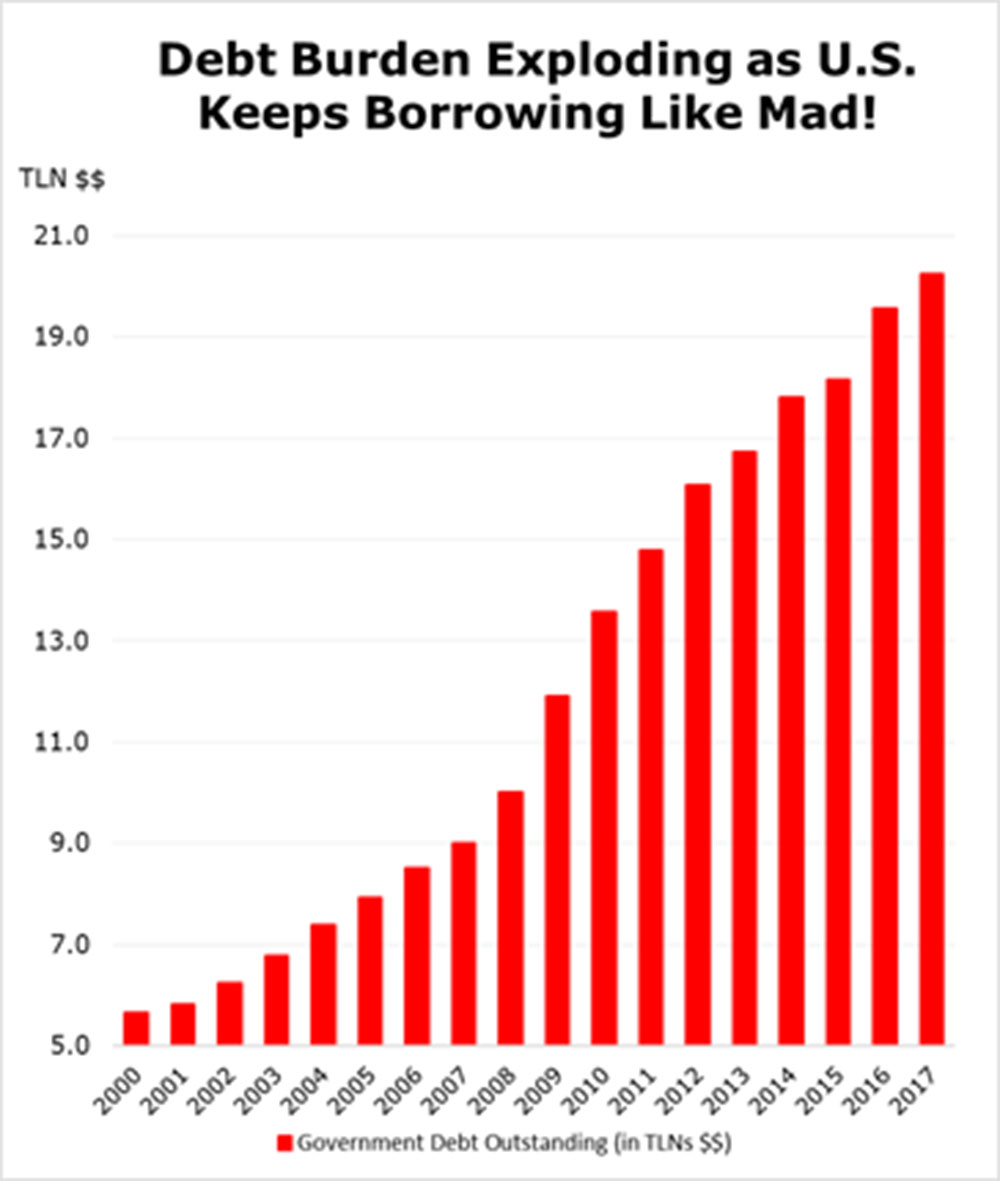 |
Fact #5. More so than anytime in history, the madness has gone global: A total of 667 interest rate cuts worldwide. More than $15 trillion of global money printing.
Fact #6. Central banks have bailed a lot more kinds of assets than ever before. Not just banks and bonds markets, but also manufacturers, insurance companies, brokerage firms, stocks and ETFs. This is especially true in Japan, and as a result, its central bank’s balance sheet is now so bloated, it represents nearly 100% of the country’s entire GDP (compared to just 20% before the housing bust).
Fact #7. It’s not just governments that have been borrowing like mad. Corporations have gone bonkers, too. You can see that the level of corporate indebtedness held fairly steady in the early 2000s. But it has since ballooned like crazy. The tally rose to $6.09 trillion in late 2017 from $3.31 trillion a decade earlier – a stunning 84% surge!
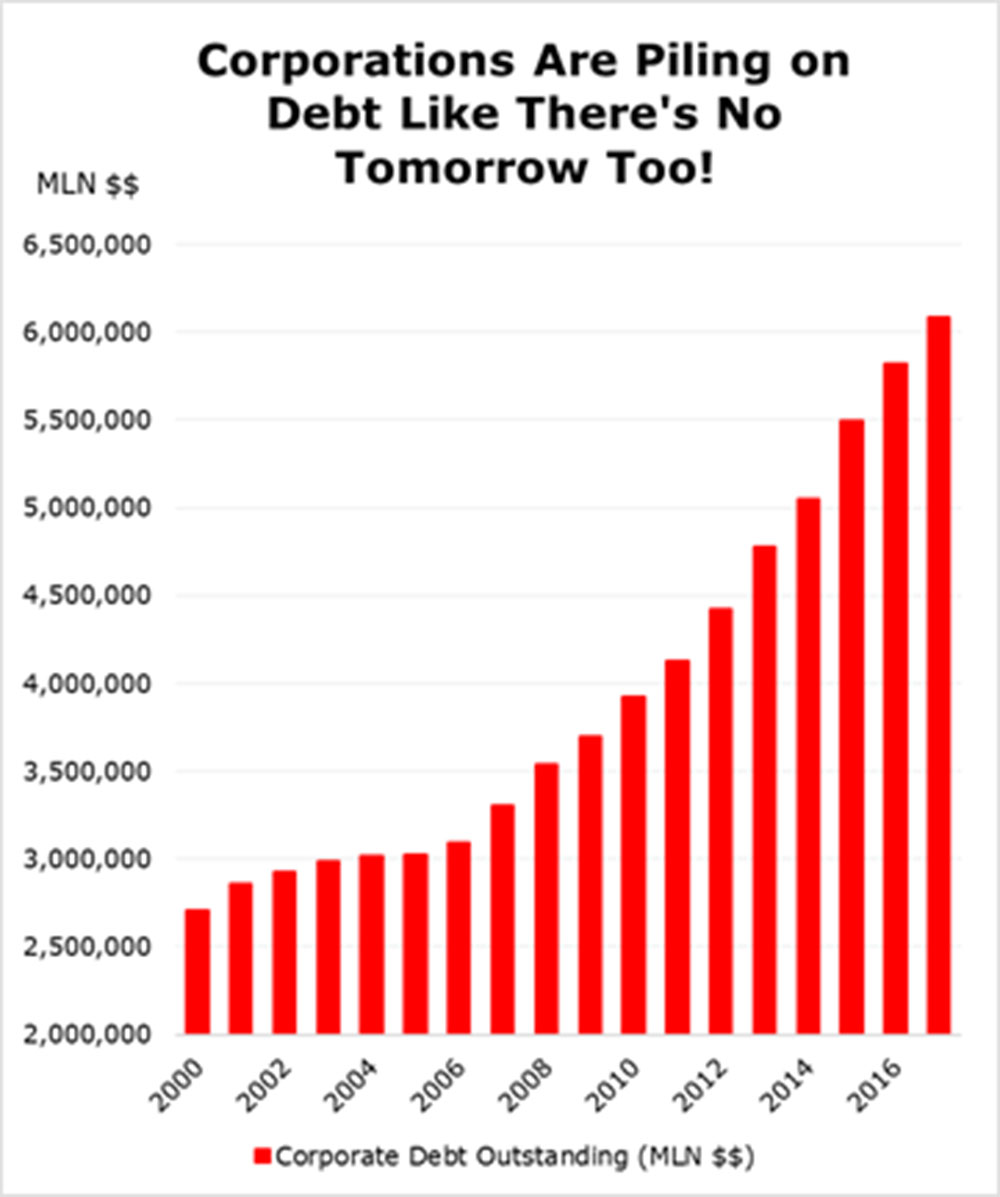 |
Fact #8. In a stable economy, people’s asset values and should rise pretty much in tandem with their income. But that’s not what happens in a bubble economy. Instead, asset values are inflated to kingdom come while their income falls far behind.
When they get too far out of whack, you can almost bet that a big bust is not too far away:
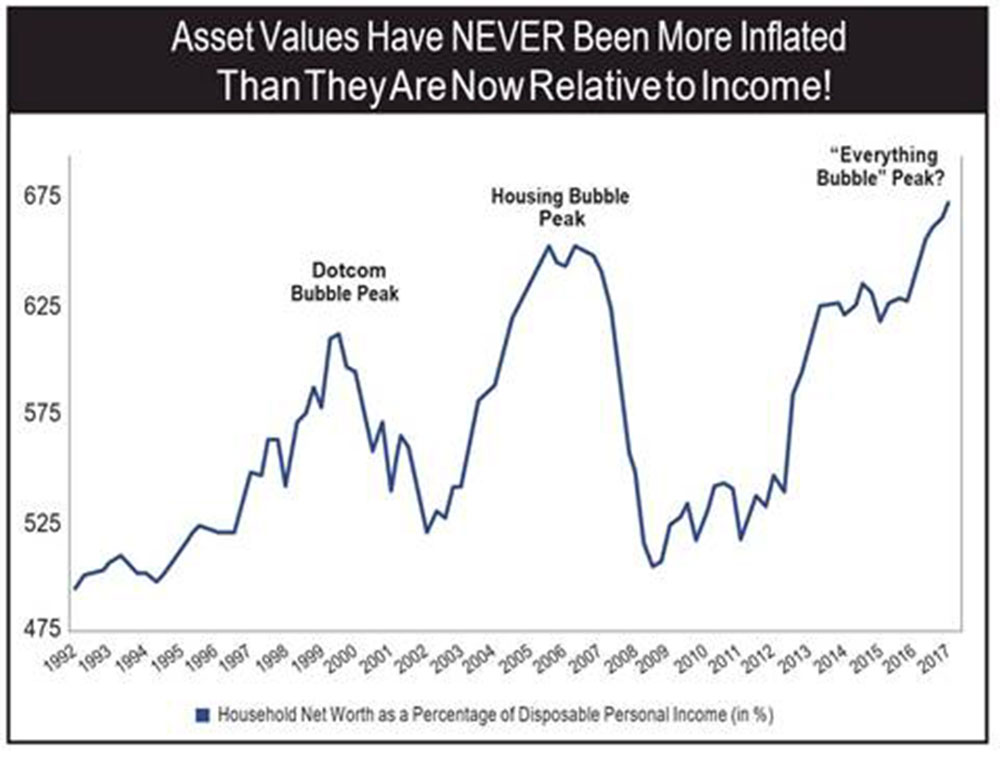 |
That’s exactly what happened just before the Tech Wreck of 2000.
It’s also what happened before Housing Bust of 2007, only worse.
And it’s also what we’re seeing today — the worst of all.
Never before have we seen a wider gulf between inflated asset values and the rewards of actual sweat-of-our-brows work! Never before have we seen a global speculative bubble that is so extreme and so broad.
In fact, it’s so widespread, we can find no appropriate words to describe it except perhaps ...
The Everything Bubble
It’s like the Blob. It engulfs every asset imaginable.
Stocks of all colors types and sizes ... so-called “safe” government bonds and ultra-high-risk junk bonds ... small homes in Texas and billionaires-row condos in Manhattan ... avant-garde artwork and Old World masterpieces ... collectibles, trinkets, trophies.
Last November, Leonardo Da Vinci’s Salvator Mundi sold for $450 million, more than double the previous auction record for any piece of art in history. A 31,500-square-foot penthouse in Monaco recently went up for sale at a world record $335 million. A 1952 Mickey Mantle baseball card is hitting the market later in March, estimated to fetch at least $3.5 million and dwarfing the previous record by at least $400,000.
My father used to say: “When the stock market’s about to crash, no one on the exchange is going to ring any bells.” No, maybe not on the exchange.
But for the alert observer, every factoid we’ve given you today is a telltale sign that leads to one singular conclusion ...
It’s time. The bear market may take a while to emerge. But the bull market in asset values is on its last legs and could soon begin to die.
A major top in the stock market is forming or about to form.
A new crisis — this time in sovereign debts — is closing in.
Any bear market which follows is bound to be very, very severe.
The good news is that you still have time to prepare.
Stay tuned for how and when.
Best wishes,
Martin Weiss and Mike Larson