|
Key Takeaways
|
 |
| By Sandeep Kaur Reviewed by: Beth Canova |
Bitcoin lost more than half its value in the twelve months after its October 2025 record, yet the market's aggregate cost basis never broke. Not once in this drawdown did price close below the average price at which the existing supply was acquired, a line that both the 2018 and 2022 bear markets breached for four to six months. The selling arrived in distinct waves from three different groups, and the core holder base absorbed all of them. That composition, more than the size of the decline, is what allocators should be underwriting.
The Story
On 6 October 2025, Bitcoin closed at $124,715, its highest daily close on record, after touching roughly $126,000 intraday. Four days later the market went through the largest forced-selling event in its history. Across all crypto venues, $19.15 billion of leveraged positions were liquidated on 10 October, and $16.69 billion of that, about 87%, was long exposure.
The common retelling treats everything that followed as a single collapse that ran from the October top to the 30 June 2026 close of $58,544. The data says otherwise. The decline unfolded in three separate phases over nine months, and each had a different marginal seller: leveraged traders in October, US spot holders and recent buyers capitulating into a cross-asset sell-off in February, and ETF holders in May and June. Between those waves, new buyers kept arriving, often at prices well above where the market eventually bottomed.
Bitcoin has since recovered to about $84,000, still roughly a third below its peak. With a full year of data now in hand, the useful question is no longer how far the price fell. It is who did the selling, who absorbed it, and what that composition implies for the risk profile of the asset from here.
The Question
When Bitcoin lost half its value, which holders actually sold, which held, and does the answer describe a market that is structurally weaker or structurally stronger than the one that peaked a year ago?
Anatomy of the Drawdown
Each leg of the decline had a different marginal seller. The cost basis of the overall market barely moved through any of them.
|
Phase |
Price (daily close) |
Marginal seller |
What the data shows |
|
1. The flush, 6 to 11 Oct 2025 |
$124,715 to $110,811 (−11%) |
Leveraged longs |
$16.7B of longs liquidated market-wide on 10 Oct. BTC futures open interest fell 21% in coin terms in five days. |
|
2. The late buyers, Oct 2025 to Jan 2026 |
Held a $85,000 to $97,000 range |
ETF holders sold, new spot buyers bought |
ETFs shed about 70,000 BTC from November to January. Realized cap still rose 3.6% to a record $1.127T on 26 Nov as dip buyers paid up. |
|
3. The macro capitulation, 23 Jan to 5 Feb 2026 |
$89,521 to $62,840 (−30%) |
US spot sellers and short-term holders, with traders pressing shorts |
A tech and precious-metals sell-off spread into crypto. Short-term holders sold at a loss on all 14 days, ETFs shed about 28,000 BTC, and Coinbase hit its deepest discount of the year on 5 Feb. Futures open interest rose 15% into the low as traders added shorts. |
|
4. The redemptions, 10 May to 30 Jun 2026 |
$82,186 to $58,544 (−29%) |
ETF holders |
Net ETF outflows of about 105,800 BTC ($7.0B) in May and June, the largest two-month outflow since the funds launched. June alone was the largest single month. |
|
5. The recovery, Jul to Oct 2026 |
$58,544 to about $84,000 (+44%) |
Short sellers forced to cover, then returning ETF buyers |
About $1.2B of shorts liquidated 19 to 21 Aug as price ran from $64,700 to $78,300 in three sessions. ETF inflows of $3.4B in August and $2.6B in September. |
Evidence 1: The Cost Basis Held
Every bitcoin carries an on-chain record of the price at which it last moved. Averaging those prices across the entire supply gives the realized price, the market's aggregate cost basis. On 21 October it stood at $53,977, against a spot price of $84,036. The average coin is held at a gain of about 56%.
The more important observation is what happened at the low. On 30 June, when Bitcoin closed at $58,544, realized price was $53,136. At the worst point of a 53% drawdown, price was still 10% above the average holder's cost. Price did not close below realized price on a single day of this bear market.
That matters because of what happens below the line. When price trades under the aggregate cost basis, the average holder is underwater, and loss-taking tends to feed on itself as each wave of capitulation pushes the next cohort below breakeven. In 2018, price closed below realized price for 134 days and bottomed at 0.70 times cost basis. In 2022, it spent 179 days below and bottomed at 0.76. This cycle never entered that regime. At the same point in the cycle, 380 days after the peak, the 2018 and 2022 markets sat at roughly 0.84 and 0.82 times cost basis. Today the figure is 1.56.
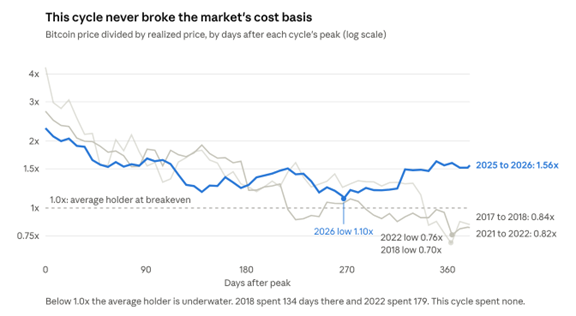
Glassnode daily price, realized cap and supply; ratio computed and sampled weekly with each cycle's exact low added. Peaks: 17 Dec 2017, 10 Nov 2021, 6 Oct 2025.
Realized cap tells the same story in dollar terms. Because it tracks the capital actually committed to the coin supply, it only falls when coins change hands at a loss. From its peak to its trough this cycle, it declined 6%. In 2018 and 2022 the equivalent declines were about 17% and 19%. Loss-taking destroyed roughly a third as much capital as in either prior bear market, even though this price decline was still severe.
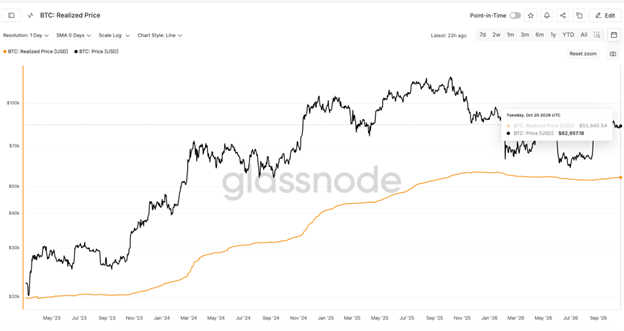
The analysis should be two-sided. Realized price has drifted down from its peak of $56,470 on 26 November 2025, and that drift has a clear source. The buyers who paid $85,000 to $97,000 between November and January absorbed much of the early selling, and the decline in realized cap that followed is consistent with many of them selling at a loss in February and June. The cost basis did not break, but it did take damage, and the damage was concentrated in the newest money. Those who still hold from that period are at or slightly below breakeven at today's price, which makes $85,000 to $97,000 the most important overhead supply zone the market faces.
Evidence 2: Leverage, Measured Properly
The headline figure is dramatic. On Glassnode's large-cap open interest series, outstanding derivatives exposure fell from about $162.6 billion on 6 October 2025 to about $78.7 billion on 20 October 2026, a decline of more than half. It is also the figure most likely to mislead, because open interest measured in dollars falls mechanically when price falls. A position of the same size in bitcoin is worth less in dollars at $84,000 than at $124,000, even if nobody closed anything.
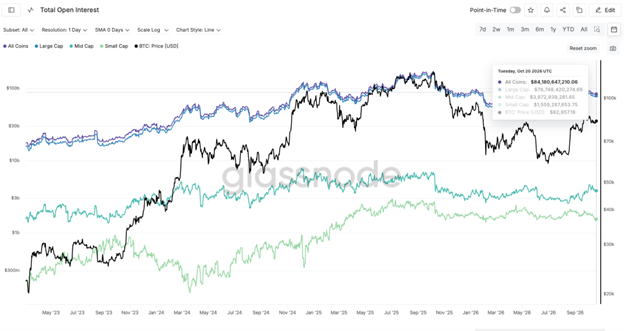
Stripping out the price effect gives a more sober picture. Measured in coins, Bitcoin futures open interest stands at about 459,900 BTC, against 557,800 BTC at the peak, a reduction of roughly 18%. The estimated leverage ratio, which scales futures positions against exchange reserves, has fallen from 0.34 to 0.25, about a quarter lower, and set its cycle low of 0.24 in mid-September. Leverage is genuinely lower. It is not half of what it was.
The path matters as much as the level, and February is where the common narrative goes wrong. The second leg down, from $89,521 on 23 January to $62,840 on 5 February, is widely remembered as another leverage flush. The derivatives data does not support that. Futures open interest rose from about 433,000 BTC to 498,000 BTC through the decline, and the leverage ratio climbed from 0.26 to 0.30. Some longs were liquidated along the way, but on net traders were adding positions into the fall, largely shorts. Leverage was growing, not unwinding.
The selling came from spot. A sell-off in technology stocks and a sharp break in precious metals spread into crypto. Short-term holders sold at a loss on every one of those 14 days, ETFs redeemed about 28,000 BTC, and on 5 February the Coinbase premium reached its deepest discount of the entire year, a clear sign that US spot holders were the ones hitting bids. Realized cap fell $13.4 billion in two weeks as recent buyers capitulated.
The leverage event came the day after. On 6 February, price rebounded 12% and futures open interest fell by about 50,600 BTC, the second-largest one-day drop of the cycle after 10 October. That was shorts covering into a market they had pressed too far. Traders kept rebuilding after that, and by mid-August futures open interest had climbed back to about 535,000 BTC, close to its pre-crash level in coin terms.
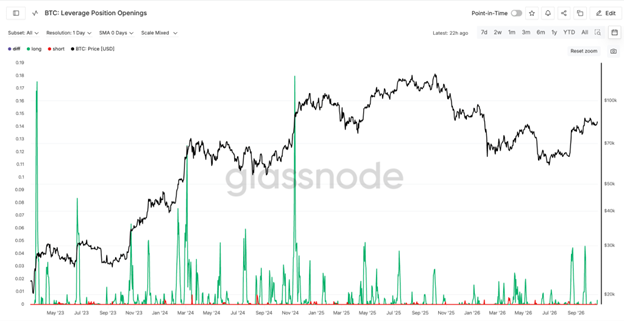
What changed this time was the direction of that positioning. The market was crowded short at the lows, and the breakout from $64,700 to $78,300 between 19 and 21 August forced about $1.2 billion of short liquidations in three sessions. Glassnode's closure data shows another large short-side flush on 27 September, near $84,500. Part of the recovery was therefore mechanical, driven by shorts covering rather than by new buyers. New leveraged longs, by contrast, have been opened cautiously. The largest recent reading on Glassnode's long-opening measure, on 22 September, was about a quarter of the peaks seen in late 2024.
The less discussed change is in the instruments themselves. Bitcoin options open interest now stands at about 470,600 BTC, slightly more than futures. Before the crash, options were about three-quarters the size of futures. More of the market’s positioning now sits in options rather than leveraged futures. An option buyer can lose only what they paid, so their position cannot be force-sold the way a futures position can. That lowers the risk of another chain reaction like October’s, though it does not remove it, since option sellers and the dealers who hedge them can still add pressure in a sharp move. The dollar open interest figure misses this shift entirely.”
Evidence 3: The Fund Holders Rotated, Then Redeemed
US spot Bitcoin ETFs are the clearest window into how traditional capital behaved, and the record is more nuanced than either the bullish or bearish headlines suggest.
The long-run picture is intact. Cumulative net inflows since launch stand at roughly $58 billion on Farside's data, with BlackRock's IBIT at about $66.5 billion and the higher-fee Grayscale Bitcoin Trust at about −$28 billion. Since the October 2025 peak, the net figure is modest: about $3.7 billion more has left than entered, on Glassnode's per-fund data, against a complex holding well over $100 billion.
The composition of that figure tells two different stories. The first is rotation. Since the peak, GBTC has lost about $4.1 billion while IBIT has gained $2.7 billion, Grayscale's own low-cost Mini Trust $1.0 billion, and Morgan Stanley's MSBT, launched in April at a 0.14% fee, about $0.8 billion. That is fee-driven reallocation within the asset class, and it looks a great deal like the shift from active mutual funds into low-cost index products over the past two decades.
The second story is genuine de-risking, and it should not be explained away. Fidelity's FBTC, which charges a fee in line with IBIT, saw about $2.2 billion of net outflows since the peak, and ARK's ARKB about $1.2 billion. That is not fee shopping. More significantly, May and June 2026 produced net outflows of about 105,800 BTC, roughly $7.0 billion, the largest two-month outflow since the funds launched, with June the largest single month on record. Those redemptions were the marginal seller into the June low.
The third quarter then almost exactly reversed the second. ETFs shed about 79,600 BTC from April to June and took back about 79,800 BTC from July to September. The capital that left near the low largely returned within a quarter. The lesson for allocators is that the ETF channel brings in a mix of committed and tactical money. It deepens the market's base, but it also gives price-sensitive capital a fast way in and out, and that capital moved the price at the margin in both directions this year.
The Institutional Lens
Institutional allocators do not underwrite an asset on its drawdown alone. They underwrite the behavior of its holder base under stress, because that determines how deep the next drawdown can go and how long it can last. On that measure, this year produced stronger evidence than either of the last two bear markets.
The first reason is compression at both ends of the range. At the October 2025 peak, price stood at 2.29 times the market's cost basis, against 4.29 in December 2017 and 2.72 in November 2021. At the trough, it fell to 1.10, against 0.70 and 0.76 in the prior two cycles. The euphoria was smaller and so was the despair. That is the signature of a holder base increasingly made up of entities with longer horizons and formal risk processes: ETF sponsors, corporate treasuries, registered advisers and the wealth platforms that now distribute the product. It is also consistent with the broader shift underway, in which traditional finance is moving onto crypto rails rather than crypto moving into traditional finance.
The second reason is who absorbs supply. Corporate treasuries alone hold about 1.30 million BTC, roughly 6.2% of all bitcoin in existence, across 180 public companies on CoinGecko's data. That supply rarely trades. And they are still buying. The 15 largest treasury companies added about 19,700 BTC over the past 90 days, 11,200 BTC of it in the last 30, led by Strive with about 14,000 BTC and Strategy with about 4,700. The buying has, however, become more concentrated. Strategy trades at roughly 0.89 times the value of its bitcoin, which makes issuing new shares to buy more harder to justify, and several large holders have added nothing this quarter. The treasury bid has not disappeared. It has narrowed to a handful of companies with access to capital, which makes it steady but not large enough on its own to lead the market.
The US picture is split, and the split is where the institutional view turns cautious. US demand has returned through the ETF wrapper, with about $6.0 billion of net inflows in August and September. On the open market it has not. The Coinbase premium, the gap between Bitcoin's price on the largest US exchange and on Binance, has been negative on about 96% of days since July, against roughly 45% of days through 2024 and 2025. Part of that gap is mechanical, because ETF purchases are largely executed through prime brokers and OTC desks and do not lift Coinbase's quoted price. It still means the buyer setting price on exchanges has been offshore, while US money arrives in slower, allocation-driven blocks. The recovery from $58,500 has stood on three legs: short covering in August and September, ETF inflows, and offshore spot demand. Only the second is the sticky institutional capital that makes a floor durable.
The synthesis is a market with a sturdier floor and a thinner engine. The holder base has demonstrated it will not capitulate at a 50% drawdown. What it has not yet demonstrated is US spot demand on the open market large enough to absorb the $85,000 to $97,000 overhang without help from short squeezes.
What It Means for You: The Probabilities
Description is not enough. The question a reader is paying to have answered is how the odds are tilted from here, so this section sets out the historical base rate, adjusts it for what this cycle has shown, and puts numbers on the outcomes.
The base rate. Today Bitcoin trades at about 1.56 times the market's cost basis and roughly 25% to 35% below its high of the past year. Since 2012, that combination has occurred in five distinct episodes: 2012, 2016, 2019 to 2020, 2022 and 2023. In four of the five, price was higher twelve months later. The path, however, was rarely smooth. Across those episodes, the median worst decline at some point in the following year was about 40%, and in two of the five, price fell back below the cost basis before recovering: the March 2020 pandemic crash and the 2022 Luna and FTX collapses. Both were triggered by outside shocks rather than by ordinary selling. History therefore says the odds over twelve months have favored holders, but that the journey has often included one more severe drawdown. One caution on this comparison: all five episodes predate the spot ETFs. Since January 2024 the owner base has changed, with ETFs, registered advisers and treasury companies that move on allocation cycles rather than sentiment. I treat the base rate as a starting point, not a template, and give this cycle's own evidence more weight in the adjustment that follows.
The adjustment. This cycle's evidence moves those odds in both directions. In favor: the cost basis held through a 53% decline, leverage relative to the market is a quarter lower, and more positioning now sits in options that do not force liquidations. Against: US buying has come through ETFs rather than the open market, treasury buying has narrowed to a few companies, and the $85,000 to $97,000 overhang has to be absorbed. February also showed how Bitcoin behaves in a rush for cash. As technology stocks fell, the VIX rose from about 16 to nearly 22, high-yield credit spreads widened and precious metals sold off sharply, while investors bought Treasuries and pushed the two-year yield down by about a tenth of a point. Bitcoin fell 30% in two weeks. In that kind of liquidity squeeze it trades as a high-beta risk asset, sold alongside everything else that can be sold. Its role as a hedge against currency debasement and fiscal risk plays out over years, not over a two-week scramble for liquidity.
The volatility backdrop. Institutional ownership has changed how Bitcoin moves day to day. Thirty-day realized volatility has had a median of about 40% in both 2025 and 2026, against 60% to 87% in the boom and bust years of 2017, 2021 and 2022. One-month implied volatility in the options market sits near 35%, among the lowest readings on record. Daily swings are calmer, and the market is pricing them that way.
Calmer days have not yet meant shallow drawdowns, though, and the distinction matters. Since the ETFs launched in January 2024, the typical worst decline over any following twelve months has been about 22%, close to the pre-ETF norm. About one day in three in the ETF era was followed by a fall of 30% or more within a year, against about two in five before it. Volatility has compressed. The depth of the occasional correction has compressed less, as February showed with a 30% decline in two weeks.
The scenarios, over the next six to twelve months:
|
Scenario |
Probability |
What it looks like |
What would confirm it |
|
Absorption |
53% |
Price works through the overhang in a $70,000 to $97,000 range while realized price begins to rise again. |
ETF inflows steady, Coinbase premium near zero, realized price turning up. |
|
Breakout |
32% |
Sustained daily closes above $97,000, opening a path back toward the $124,700 record. |
Coinbase premium positive for several weeks, inflows led by IBIT and FBTC, price rising while the leverage ratio stays below 0.30. |
|
Retest |
15% |
A return to the $54,000 to $65,000 zone, between realized price and the June low. |
A cross-asset risk-off like February, the leverage ratio back above 0.33, outflows concentrated in the low-fee funds. |
Within the retest scenario sits the outcome that would break this analysis: a daily close below realized price. I put that at about 15%, well below the historical rate of two in five, because the two prior breaches required outside shocks and this holder base has already absorbed a 53% decline without breaking.
How to read this. The odds favor patient holders, and the greater risk lies in the path rather than the destination. From $84,000, realized price sits about 36% below and the record about 48% above. A calmer market should not be mistaken for one without corrections, which is why institutional allocators size Bitcoin to withstand a decline of the kind seen this year and act on the confirming signals rather than the calendar. These probabilities are my framework's assessment of the market, not personal investment advice, and I will revise them in these pages as the signals change.
What Would Change My Mind
- A daily close below realized price, currently about $54,000. That would mean the average holder is underwater for the first time this cycle, and the central finding of this piece would no longer hold.
- Leverage rebuilding without spot demand behind it. A return of futures open interest toward the 558,000 BTC seen at the peak, or of the leverage ratio above 0.33, while the Coinbase premium stays negative, would recreate the conditions of October 2025.
- Outflows from the low-fee funds. Another May-to-June episode concentrated in IBIT and FBTC, rather than in GBTC, would signal that traditional capital is leaving the asset rather than repricing its fees.
- On the constructive side, a sustained positive Coinbase premium alongside steady ETF inflows. That would show US spot demand taking over from short covering, and it is the condition most likely to clear the $85,000 to $97,000 overhang.
Signals to Watch
Four measures will tell us which way this resolves, and I will track each of them in these pages: the trend in realized price, the leverage ratio together with the mix of options and futures, ETF flows broken out by fund, and the Coinbase premium.
To your wealth,
Sandeep Kaur