2022’s Inverted Yield Curves Could Spell Trouble
 |
| By Kenny Polcari |
The bond market is certainly trying to tell us something; but like most investment concepts, the message is open to interpretation.
For example, let’s look at the current relationship between the two-year and 10-year Treasury notes.
I know that talking about bonds can be akin to watching paint dry … but hang in there with me.
So, typically, the long-term bond would yield more than the short-term one, attracting investors looking for beefier income for a longer duration.
That’s not the case in 2022, though, when we can’t describe anything as typical.
As it stood a couple of days ago, two-year notes were yielding 4.3% with 10-year Treasurys kicking in 3.56%. Even one-month Treasury Bills and 12-month CDs were higher at 3.96% and 4.5%, respectively.
We call that an inverted yield curve, and it’s been with us the better part of the year — the first time it’s happened in 15 years.
The yield between the two-year and 10-year first inverted in April, returned to normal after a short time, then happened again in early July. By October, even the shorter-term three-month Treasury yields rose above the 10-year and remained that way through November.
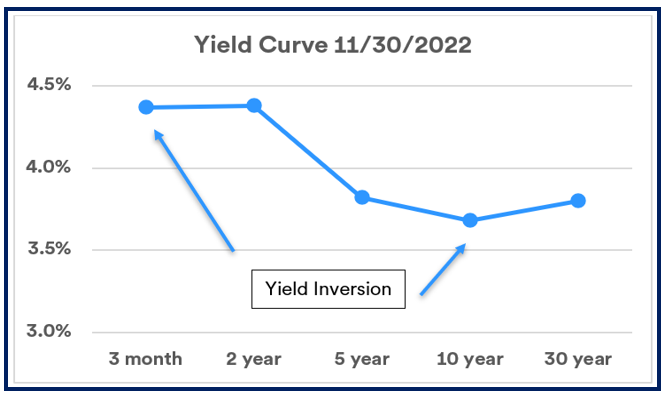
Click here to view full-sized image.
“So what?” you might say.
Well, the same yield curve inversion that’s dragged on for eight months has preceded every recession since the 1960s.
One way to gain insight into if that’s going to play out this year or next is by looking at returns for the S&P 500 during the inversion.
So far in 2022, the large-cap index has lost 17%. The only other yield inversion coupled with a negative S&P 500 return was between 1980 and 1982 when the index fell 18%.
During those two years, the U.S. economy experienced its worst downturn since the Great Depression.
Eerily Familiar
With inflation hovering around 13% in the late 1970s, the Fed tightened its monetary policy in the early ‘80s — much like it has this year — ushering in very high unemployment and a drop in the GDP.
In the ‘80s, then-Fed Chairman Paul Volcker led an anti-inflation crusade that raised the federal rate from an average 11.2% in 1979 to a peak of 20% by June 1981. Two years later, those hikes kicked inflation to the curb, and it fell below 3%.
Now, you can believe what you want to believe, but the current Fed and current Chairman Jerome Powell have never swayed from their commitment to do everything in their power to bring down the rate of inflation to 2% from its current 7.7%.
Rising rates can wreak havoc on the economy. And while we’re seeing a contraction in manufacturing data and increasing layoffs in corporate America, wages are up, payrolls are up and consumers are still buying.
You hear people complaining all the time about high prices, but actions speak louder than words.
Online sales on Black Friday and Cyber Monday broke records. Groceries, diapers, toothpaste and medicine did not make the “popular” list. Toys, electronics, computers, sporting goods, appliances, books and jewelry flew off the proverbial shelves as bargain hunters found deal after deal.
Even Norwegian Cruise Line Holdings (NCLH) reported record sales.
If people can still spend money on leisure, things can’t be that bad — and the Fed views that as more fodder to keep their foot on the pedal.
We may not see the full impact of the Fed’s work until after holiday spirit dampens and the ball drops in New York City’s Time Square at midnight on Dec. 31 for the 115th time.
I encourage you to celebrate the end of 2022 and look forward to a better 2023. I’ve got nothing against optimism or the power of positive thinking, but I rather despise the fact that investors are losing money unnecessarily.
As this year comes to a close and we enter a new one, we will continue to get hit with more economic data that will reveal the story. I’d love to agree with all the optimists out there, but I’m not convinced the Fed is done raising rates … or even close to doing so.
Safety First
That doesn’t mean I’m running for the exits — it just means I am playing it safe and building up those positions … which might include utilities, or even short-term bonds.
If you’re looking for a safe haven, consider the Utilities Select Sector SPDR Fund (XLU). The heavily trade, $15.8 billion fund is up 12% since mid-October and 1.4% year-to-date. XLU also kicks in a 3% dividend.
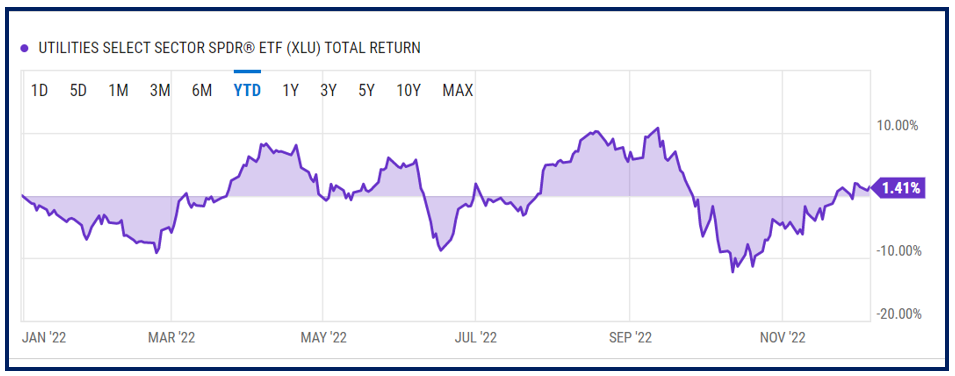
Click here to view full-sized image.
Think of the utilities play this way: Should the inverted yield prove to be an indicator of recession like it was in the 1980s, will you still be buying the latest Lego set or a Caribbean cruise?
Or will heating your home, keeping the lights on and filling your gas tank take precedent?
Bottom line: Stick to the plan.
To your wealth,
Kenny Polcari
P.S. If you're looking for ways to not only protect your wealth, but also grow it amid these volatile market conditions, consider joining my friend and colleague Tony Sagami's service, Disruptors & Dominator. Members are currently enjoying open gains of around 40%, 32% and 15%!