 |
| By Jordan Chussler |
We have two distinct seasons in Florida: wet and dry.
This makes for a poor gauge of when spring, summer, fall and winter yield to one another. So I often find myself keeping an eye on retail floor displays as a reminder.
And sooner than turkeys go on sale and often before Halloween decorations are returned to storage … stores break out the trees, the garland and the accompanying top hits of the 1940s and ‘50s.
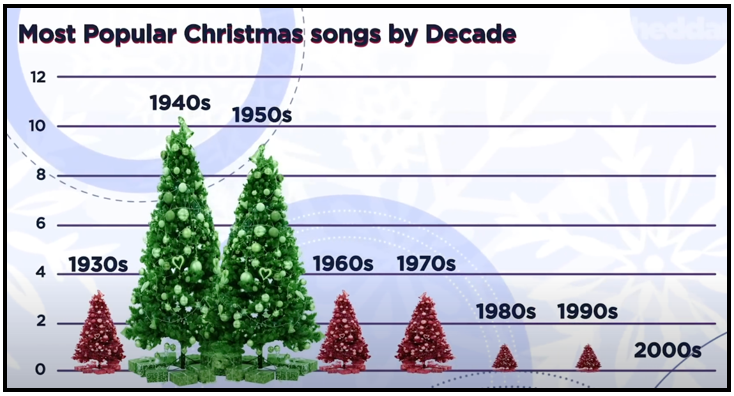
Click here to see full-sized image.
Before you know it … it’s beginning to look a lot like Christmas.
The fact is, we’re 37 days away from Black Friday … 37 days away from people forcing their way into stores like feedlot cattle … and 37 days away from sales surging at big-box retailers.
Economists are on the fence about how seasonal sales will shape up this year, and numerous conflicting macroeconomic indicators validate their concern:
- Gross domestic product contracted in Q1 and Q2. On Oct. 27, we’ll know if it will be three consecutive quarters of negative growth.
- Inflation is near a four-decade high and whether or not it subsides in the near term, it will remain elevated throughout the holiday season.
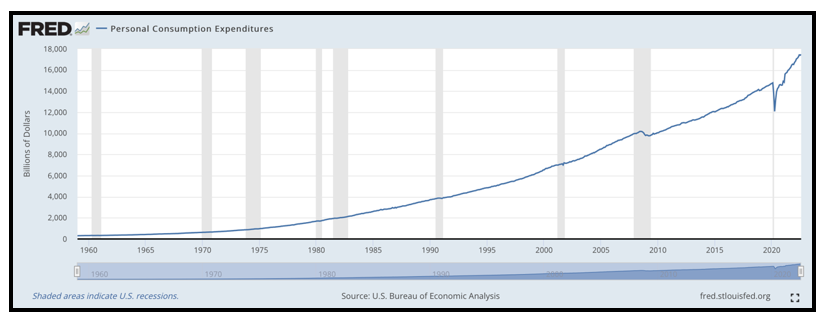
- However, consumer spending has increased each quarter since July 2020, continuously breaking previous highs.
- And the unemployment and nonfarm jobs data reported the first week of October indicates a robust labor market.
According to Mastercard (MA), U.S. retail sales are expected to grow 7.1% this holiday season over 2021.
Despite Amazon.com (AMZN) and other e-tailers continuing to disrupt brick-and-mortar retailers, as the pandemic continues to wane, e-commerce sales have slowed dramatically as in-store sales have surged.
The Yardsticks of Yuletide
While mom-and-pop shops are struggling and America’s malls are dying, big-box retailers are thriving.
Shares of those companies are viewed as value stocks, which tend to insulate investors’ holdings during downturns and bear markets while often paying dividends with attractive, market-beating yields.
The big three are household names: Costco Wholesale (COST), BJ’s Wholesale Club (BJ) and Walmart (WMT), which also owns and operates the membership-only retail chain, Sam’s Club.
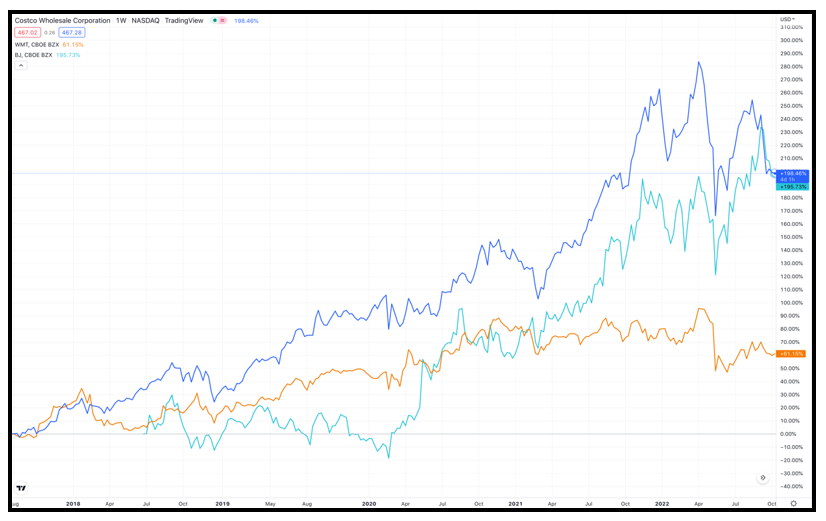
The gains these companies have produced over the past five years are hard to ignore, especially amid ongoing market volatility:
- Shares of Walmart have risen nearly 50%.
- BJ’s stock has gained over 196%.
- And Costco has seen its shares rise over 190%.
Click here to see full-sized image.
An argument can be made for all of them being in your portfolio. But taking a look at each company’s fundamentals could determine if there’s a clear-cut winner for buy-and-hold investing.
Earnings Per Share
EPS is a self-explanatory profitability indicator that’s based on past performance. It’s calculated by dividing net profit by the number of outstanding shares.
The higher this number, the more likely it is that the company is profitable. Of course, EPS — like all indicators — is no guarantee of future performance. However, it is indicative of a stock’s recent strength.
While there is no average or determining figure that suggests a gold standard for EPS, an EPS growth rate is measurable and provides a clearer picture of a company’s recent performance.
A strong EPS growth rate is over 15%. At the end of Q2:
- Costco reported year-over-year EPS growth of 11.7%.
- Walmart reported year-over-year EPS growth of 23.68%.
- And BJ’s reported year-over-year EPS growth of 28.75%.
Winner: BJ’s
Price-to-Earnings Ratios
A P/E ratio is a metric that determines whether a stock is undervalued or overvalued. It demonstrates what the market will pay for shares based on past and future earnings.
A higher P/E ratio suggests a high price relative to earnings, meaning the stock could be overvalued at its current ask. Conversely, a lower P/E ratio could insinuate an undervalued equity.
Averages vary depending on the source, but P/E ratios generally range from 15–30. Today, the current S&P 500 10-year P/E ratio is 26.6. Costco’s P/E ratio is 35.47. Walmart’s is 25.81. BJ’s is the lowest — and most appealing — at 19.64.
Winner: BJ’s
Dividend Yield
Over the long term, dividend-paying stocks outperform their non-dividend-paying counterparts. In fact, over the last 90+ years, dividends have accounted for more than 40% of total market returns.
The S&P 500’s dividend currently yields 1.82%. Of the companies discussed today, none have a dividend that exceeds that.
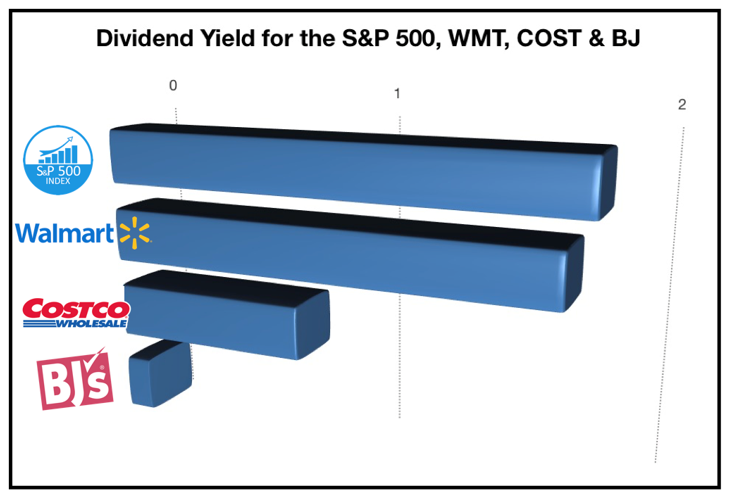
Click here to see full-sized image.
However, something is usually better than nothing. Costco’s dividend yields 0.77% annually, or $0.90/share at current prices. Walmart’s dividend pays 1.73% annually, or $0.56/share. BJ’s does not pay a dividend.
Winner: Walmart
Price Target
Price targets are highly speculative despite significant inputs used to determine them. Those data sets include cash flow, EPS and P/E ratios, which produce a high-end, median and low-end dollar amount.
Like other indicators, they are estimates. So, it’s wise to use the median figure to determine if a given equity is a “Buy,” “Sell” or “Hold.” For the three stocks evaluated today, the Wall Street Journal gives a one-year, median price target of:
- $153/share for WMT, implying a potential upside of 19% from current prices.
- $84/share for BJ, implying a potential upside of 19.6% from current prices.
- And $565/share for COST, implying a potential upside of nearly 21% from current prices.
Winner: Costco
Weiss Ratings
Each of these companies is a good bet for growth not only through year’s end but going forward.
Costco receives a “B” rating, making it a “Buy”-rated stock. It scored “Excellent” on the Weiss Ratings’ Growth Index, Efficiency Index and Solvency Index.

BJ’s Wholesale Club is graded a stronger “Buy” with a “B+” rating. It scored “Excellent” on the Weiss Ratings’ Growth Index, Efficiency Index and Total Return Index.

Walmart was the only “Hold”-rated stock of the three. It only scored “Excellent” on the Efficiency Index, with grades of “Good” on the Growth Index and Solvency Index. Of the three companies, WMT’s Dividend Index score of “Fair” was the best.

Winner: BJ’s
Each of these companies is capable of protecting your portfolio in the midst of this bear market. And each is a sound value stock with significant share price appreciation over the past several years.
With holiday season around the corner — and with the resurgence of in-store shopping — none of that should change.
As always, conduct your own due diligence before entering a trade.
Until next time,
Jordan Chussler
Managing Editor
Weiss Ratings Daily
P.S. If you’d like tailored picks in the retail space, Senior Analyst Tony Sagami’s trading service, Disruptors & Dominators, includes one big-box giant that’s produced 36% open gains for members. Click here to learn more.