 |
| By Kenny Polcari |
I always look for technical cues that tell me where the markets might be heading.
One of the simplest — and often quite accurate — tools used is moving averages.
And you don’t need to work on Wall Street or have fancy acronyms after your name to understand how to use them to your advantage.
A Lesson in Technical Analysis
First, I’ll give you the basics on moving averages. Then, I’ll explain the meaning behind the big bullish formation that happened last week in the S&P 500.
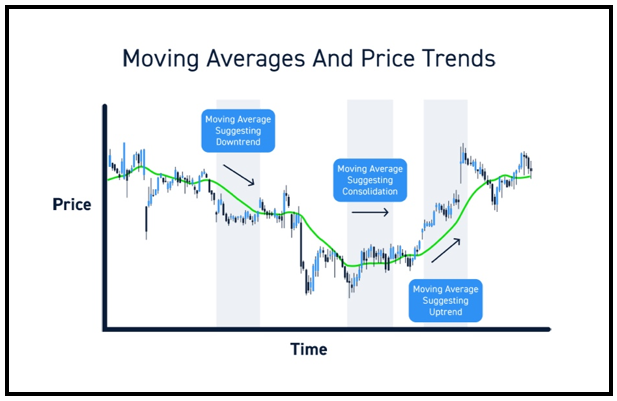
Moving averages are lines plotted on a stock chart that act as filters for screening out daily noise while still capturing much of the critical underlying market trend.
It’s a good way to understand day-to-day stock market movements that often appear random and impossible to predict.
Moving averages (50-day, 150-day and 200-day) allow us to focus on longer periods of time when stocks exhibit patterns that reveal long-, intermediate- and short-term trends.
As the name implies, averages change — or move — daily. The result after a number of days of data is a smooth, sloping line that reflects an accurate snapshot of the market’s trend.
Moving averages can slant up, down or sideways. If it’s sloping downward, it’s likely that the stock, fund or index will follow suit. If it’s gradually moving upward, it’s likely to do the opposite.
Click here to see full-sized image.
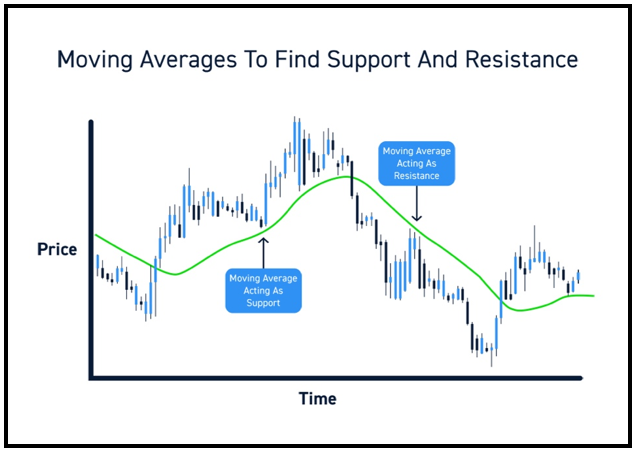
Knowing if an individual stock, fund or index is nearing a support or resistance level on its moving average can also help determine direction.
Support & Resistance
These two terms refer to price levels on charts that tend to act as barriers, preventing the price of an asset from getting pushed in a certain direction.
• A resistance level is a price where — experience and history have shown — sellers of the stock will step in and distribute (sell) their shares.
• A support level is a price where — experience and history have shown — buyers of the stock will step in and begin to accumulate (purchase) shares.
Click here to see full-sized image.
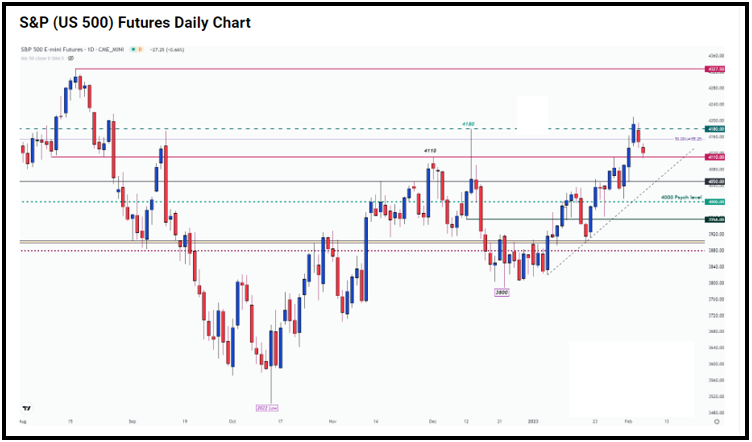
For example, everyone has been keeping an eye on the 4,000 mark in the S&P 500, a key psychological support line. As I write, the large-cap index is trading well above that point at 4,151.
However, its first line of resistance is around 4,155, and if it breaks through that barrier, we could see the S&P 500 reach its high of 4,180 that it set on Dec. 13, 2022, bringing 4,200 back into play.
Click here to see full-sized image.
On the contrary, if the S&P 500 closes below the 4,000 mark, it could test its Dec. 28, 2022, lows of 3,783.
Like all technical indicators, though, they’re not 100% accurate. That’s why it’s best not to rely solely on moving averages to make investment decisions.
Instead, you should use them in conjunction with fundamental analysis and the proprietary tools used by Weiss Ratings to determine the strongest stocks.
Now, onto that big move I mentioned earlier that the S&P 500 made on Thursday, Feb. 2: The large-cap index was …
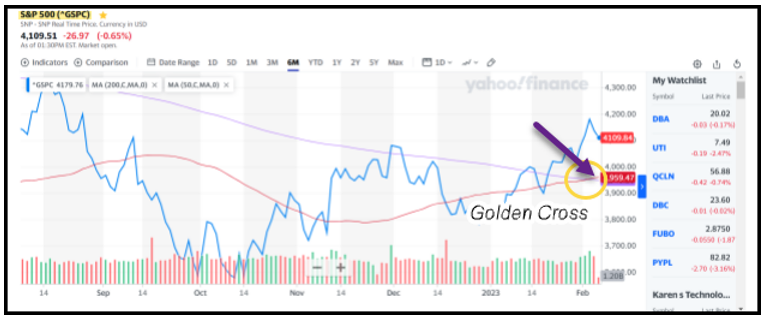
Blessed by a “Golden Cross”
A golden cross occurs when the 200-day moving average crosses above the 50-day moving average or when the long-term average price of a stock rises above its short-term average. This formation suggests the start of an uptrend.
On the contrary, a death cross occurs when the 50-day moving average falls below the 200-day moving average, meaning the short-term average price of the stock is falling below its long-term average … which could signal the start of a downtrend.
Both formations generally precede further gains or losses over the following six months to a year — but not always. We’ll have to wait and see how accurate this golden cross turns out to be. Here’s a chart of the S&P 500 showing the formation last Thursday:
Click here to see full-sized image.
After the close that day, the 50-day moving average for the S&P 500 stood at 3,953.61, a hair higher than the 200-day moving average, 3,951.58. This marks the first time this pattern has appeared since July 2020, according to FactSet data.
Since 1930, the S&P 500 has seen 52 golden crosses, according to Dow Jones Market Data. Analysts used backtested data for the years prior to the index’s creation back in 1957.
During that period, stocks traded higher one year later 71% of the time. However, it’s important to note exceptions often happen during periods of high volatility — like today.
The S&P 500 declined during the 12 months that followed the golden cross that occurred on April 1, 2019, according to Dow Jones. We also saw declines in 1999 as the dot-com bubble burst, as well as prior to the Black Monday crash in 1986.
Knowing trendlines for any stock, fund or index can provide guidance on where any position is headed. Should it shoot above a key moving average or skate through a resistance point, make sure you confirm it with other tools like Fibonacci retracements, MACD or the relative strength indicator.
Or you can just rely on Weiss Ratings for knowing what to buy or sell and when it makes the most sense to do so.
One last thing before I go …
Imagine making 50 trades with an average gain of 133% on each. Now, imagine that kind of performance in not one but two bear markets ... with only one bull in between!
Well, you don't have to imagine it. That's the actual performance of Juan Villaverde's Weiss Crypto Portfolio since 2018.
In a recent Zoom conference, he and Weiss Ratings founder, Dr. Martin Weiss, identified three performance factors that have attributed to this track record. And while past performance is no guarantee of future results, it isn't hard to imagine what could be possible with this kind of guidance now that Juan has called for the end of the most recent crypto bear.
If you want to learn more, I suggest watching that conference now. We're taking it offline tomorrow, so this may be your last chance.
To your Wealth & Wisdom,
Kenny Polcari