 |
| By Kenny Polcari |
Despite the Federal Reserve’s best efforts to convince investors that a soft landing for the economy is still possible, not too many people are buying the hyperbole.
That is especially true after the market tanked, when Fed Chair Jay Powell addressed Congress on Tuesday.
He left little doubt that the government is adamant about knocking down the rate of inflation and even suggested ratcheting up the frequency of interest rates.
Well, I have been a disbeliever about any semblance of a soft landing far before this latest hawkishness.
After Tuesday, I would imagine that many believers switched camps and realize that it’s just a matter of time before the long string of interest rate hikes put a dagger in consumer spending and the economy.
You cannot blame the people still holding out hope that the U.S. will not fall into a recession. Up until now, many of the indicators that usually turn south as the economy weakens have remained stable.
Unemployment rates remain very low in this tight labor market, and consumer spending is still resilient. So, it’s not your imagination that recent monthly reports have painted a strong picture of the economy.
What some folks may not understand is that many of the indicators that we pay the most attention to are …
Leading, not Lagging
There is a huge difference. Leading indicators are a gauge of current trends that often change directions quickly. Lagging indicators become relevant only after an economic shift has taken place.
So, for example, the corporate layoffs that began late in 2022 are still not being reflected in the official unemployment report. Waiting until a mess hits the fan is akin to being reactive instead of proactive.
That’s especially true when these two lagging indicators commonly used to predict a recession are already flashing warning signs.
One is the yield curve inversion between the 2-year and 10-year Treasurys, and the second is weakness in the Dow Jones Transportation Average. When these two events happen independently from each other, it raises a yellow flag.
When they happen simultaneously, many economists begin seeing red. We are seeing a deepening shade of red today.
The yield of the 10-year Treasury note closed below the 20-year Treasury yield on March 29, 2022, for the first time in nearly three years.
And the yield remains inverted today.
As for the DJT, it fell 19% in 2022. And while the Transportation Index is up year to date, it has fallen 10% from its peak on Feb. 1.
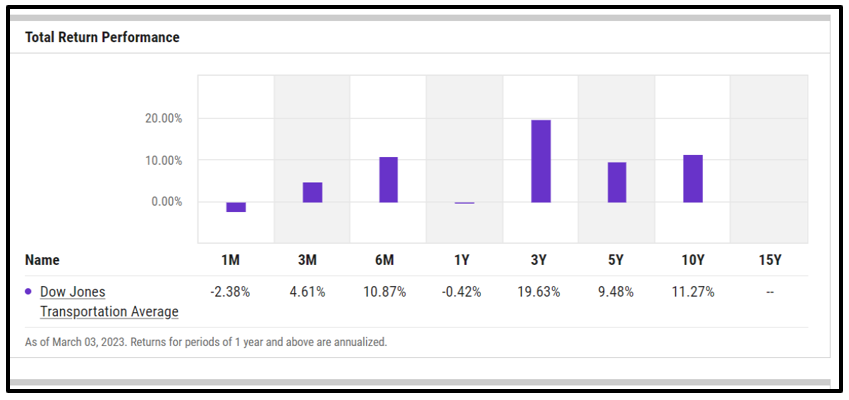
Click here to view full-sized image.
Let me explain why these indicators warrant attention.
The inversion suggests the obvious: Investors are worried that more aggressive interest rate hikes will tame economic growth.
The yield curve measures the difference between a bank’s cost of money vs. what it will make by lending it out or investing it over a longer period. If banks cannot make money, lending slows and so does economic activity.
When the curve inverts, “There has been a better than two-thirds chance of a recession at some point in the next year and a greater than 98% chance of a recession at some point in the next two years,” according to Bespoke Financials.
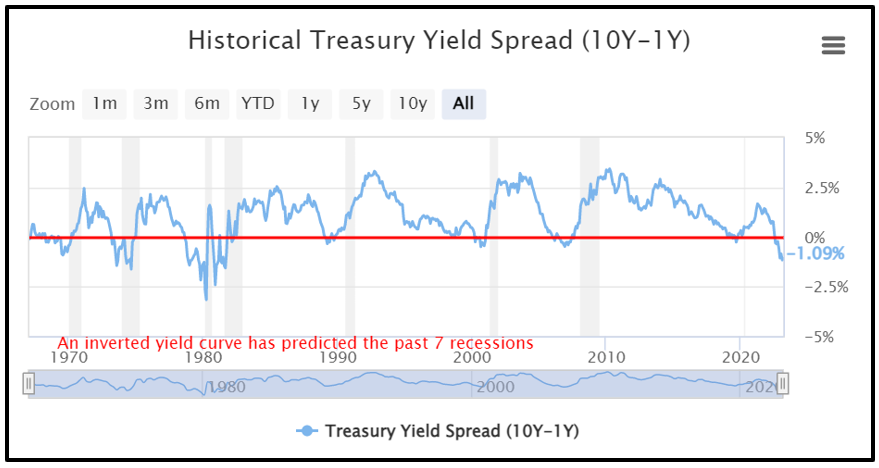
Click here to view full-sized image.
Another report by BCA Research showed that the 2-year/10-year Treasury slope has inverted in advance of seven of the past eight recessions and has never sent a false signal.
While the yield curve has sent somewhat reliable signals about pending recessions, there is often a long lag time — up to two years. The inversion hasn’t reversed since July 2022, so we’ve got a long way before that potential recessionary window closes.
However, analysts always look for corroborating evidence, which leads me straight to …
The Transportation Sector
Moving goods from manufacturer to consumer is the backbone of every country’s economy as it connects every single component of every single supply chain.
So, when this sector slows, it correlates directly to the economy and consumer spending.
If inflation does not fall extensively, we’ll eventually see the steady erosion of consumer spending power and sentiment.
As a result, companies that transport and deliver goods may see demand drop, while higher fuel prices squeeze the companies’ margins.
Since the DJT is also a lagging indicator, you may want to keep a close eye on its trajectory. If it continues to fall, I’d be seeking safety in all corners of the market.
But do not wait until the story hits Wall Street and dominates headlines. By that time, a slower economy or beginning of a recession could already be causing damage to your portfolio.
So, when I suggest that you pick stocks that can weather any storm, raise cash or maybe dip into bonds, I am just trying to help you get ahead of the proverbial eight ball and prevent potential damage.
Being in the right assets at the right time also means that when all the recessionary dust clears and a bull market emerges, you will be positioned to capture the kinds of explosive gains synonymous with a bear-bull transition.
To your Wealth & Wisdom,
Kenny Polcari
P.S. America could default on its debt as soon as July, triggering the worst economic earthquake in history. What can investors do? The best option is a strategy is one that works regardless of volatility. Over the past five years, one little-known strategy produced 535 real winning trades, averaging 16% gains in just four days. Join Dr. Martin Weiss for an urgent video briefing where he reveals how to put this strategy to work starting immediately.