Ethereum is the world’s first and largest platform used by organizations all over the world to raise funds with Initial Coin Offerings (ICOs).
Here’s how it usually works: You’re running a start-up. You want to sell your tokens to the public. So you offer them in exchange for Ether, the native coin of the Ethereum platform. And unless you trade it off, you naturally accumulate lots of Ether in your wallet.
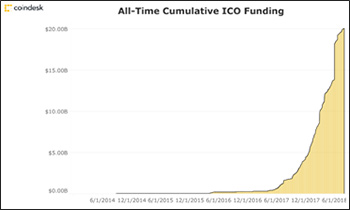
The numbers have been staggering: $5 billion raised in 2017 during the Bitcoin boom … and then another $15 billion raised so far in 2018, despite the Bitcoin crash.
 |
This illustrates the tremendous potential of ICOs — eclipsing the global market for venture capital and, in the future, possibly emerging as a serious competitor with Initial Public Offerings (IPOs) of stocks.
Starting on May 6, however, the price of Ether turned down sharply. It has plunged from US$829 to US$289, down 65%. Against Bitcoin, it’s down 52% in the same period.
What happened? Is there something fundamentally wrong with Ethereum and the ICO marketplace? Or is this just another of the many crypto crashes that have come and gone in recent years?
As usual, market sages and naysayers favor the former. They try to find a boogeyman or create a bogus theory to explain the decline.
When Bitcoin crashed back in January, the popular conspiracy theory of the day was that the trustee who managed the failed Mt. Gox exchange was dumping in huge amounts.
Plus, a raft of other “experts” declared, for the umpteenth time, that “Bitcoin was dead.”
This time, they’ve come up a whole new theory to explain the “end of Ethereum.”
Supposedly, ICO teams have been dumping their Ether in large amounts, panic-selling all the way down. And this, in turn, seems intended to imply that ICOs — the primary use-case for Ethereum — are losing faith in the entire concept. (See, for example, Peter Saddington and Arthur Hayes, CEO of BitMEX.)
Is this true? As I’ll explain now, the answer is a flat “NO!”
Here’s proof that ICOs are not dumping Ether!
The single source of the latest anti-Ethereum theories is a single website, which tracks the movement of Ether out of ICO wallets.
Trouble is, they’re looking at the wrong numbers: Instead of using the aggregate totals, they’re looking exclusively at a select group of sellers and ignoring the rest.
They point to ICO projects like Cobinhood (COB), which has sold 24,000 Ether in the last 30 days. Or they highlight Atonomi (ATMI), which has sold 13,000. They then portray these kinds of stats as “evidence” that there’s a big Ethereum exodus underway.
But all it takes is a quick glance at the total picture to reach an entirely different conclusion:
 |
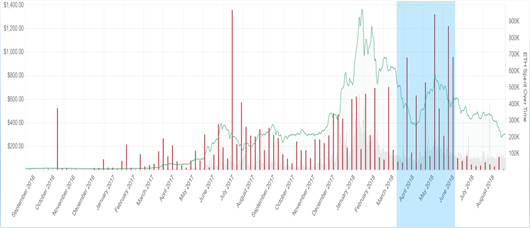
In the chart above, the green line is the price of Ether in U.S. dollars.
The red vertical lines show the movement of Ether out of individual wallets.
And the area highlighted in blue shows the period when most of the selling presumably occurred — between April and June of this year.
Now, here’s the key: During that period, the price of Ethereum was down, up and down again. It ended the period at approximately the same level as it began — near the $600 level.
This means there’s no correlation whatsoever between the selling and the price of Ethereum. If anything, nearly all the “big selling” was offset by equally big buying.
Thus, the reality behind the Ethereum plunge is far less exotic than certain creative imaginations might suggest, namely that …
Liquidity has taken a cliff-dive.
When markets are liquid, prices tend to be more stable. This doesn’t stop them from rising or falling. But it does usually prevent extreme price explosions and crashes.
When markets are illiquid, however, price movements are often greatly exaggerated.
That’s the perennial story so far with cryptocurrencies, even among the more actively traded coins like Bitcoin and Ethereum.
And that’s what largely explains the price crashes we’ve seen most recently in altcoins, including Ethereum. No surprise here! It happens all the time.
Another Big Disconnect
The “ICO dumping” theory also fails to explain why most other altcoins are also seeing their price collapse in tandem with Ethereum.
Could it be argued that ICOs are also dumping Cardano, EOS, NEO, XRP or NEM too? Hardly! Most ICO teams don’t even hold those coins to begin with.
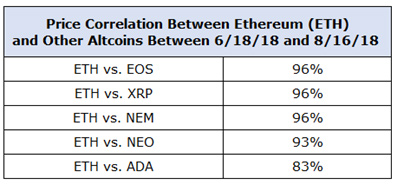
To put some meat behind this point, I ran some correlation stats comparing Ether price movements to those of other altcoins. For the two-month period corresponding to the latest round of price drops, here’s what I found:
 |
EOS, XRP and NEM had a 96% price correlation with Ethereum. NEO’s was 93%. And Cardano’s price movements, despite a bump due to speculation about it getting added to Coinbase, were still 83% in sync with Ethereum’s.
Thus …
Statistically speaking, there’s no significant difference between the price behavior of Ethereum and other altcoins!
So how do you explain the price decline?
It’s not by concocting fairytales. Rather, the primary reason for the fall in the altcoins is, again, far simpler: the lack of liquidity combined with a negative overall sentiment toward crypto markets.
And this negativity is nothing more, nothing less than the mirror image of last year’s irrational exuberance.
Markets move in cycles, and illiquidity creates a neverending merry-go-round of fear and hope.
Too much optimism leads to excessive pessimism. Excessive pessimism, in turn, is typically the precursor of new bull markets.
The solution:
More liquidity = more stability
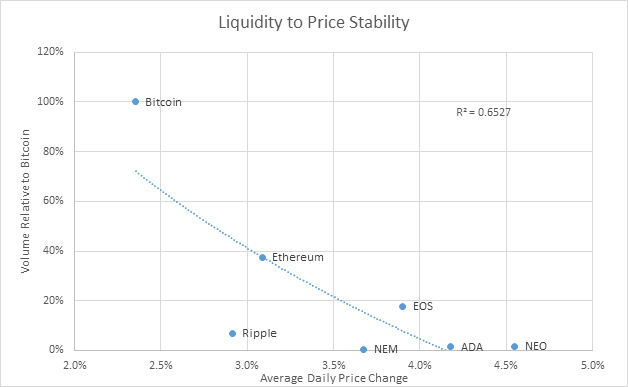
To bring this point home, I have compared two metrics:
Metric #1. Liquidity relative to Bitcoin (left axis in chart below)
Metric #2. Price stability (bottom axis)
 |
Bitcoin, in the upper left of the chart, is the most-liquid and also the most-stable. That’s not a coincidence.
NEO, in the lower left, is among the least-liquid and the least-stable. That’s also not a coincidence.
And Ethereum is in between, proving my thesis: Ethereum’s decline has nothing to do with ICOs. And it also doesn’t mean Ethereum is dying.
With markets continuing to be illiquid, all it does mean is that the next price rise is bound to be just as dramatic as the recent price decline.
Best,
Juan

