MariMed Inc.
MRMD
$0.07
$0.000.46%
OTC PK
Compare
Stock, Sector and Industry Compare — Invest with Absolute Confidence
Access Instant Stock Comparisons
Make improved investment decisions and instantly compare the ratings and key financial data of any stock against its sector, industry or competitor. The compare tool in Weiss Ratings Plus gives you unmatched visibility allowing you to quickly compare performance, rating factors, growth potential and financial health. Clearly see the strengths and weaknesses of every investment and gain confidence before you invest by joining Weiss Ratings Plus.
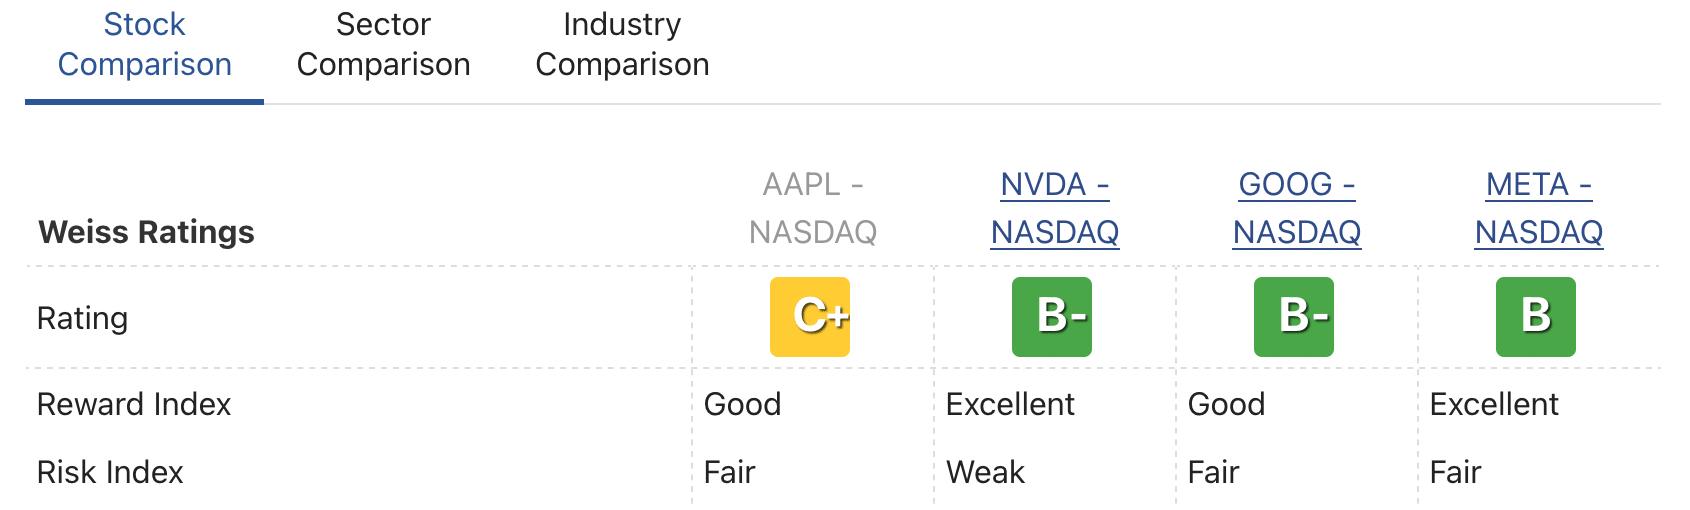
Sample Comparisons of Apple Inc. to Nvidia Corp., Alphabet Inc., Meta Platforms Inc.:
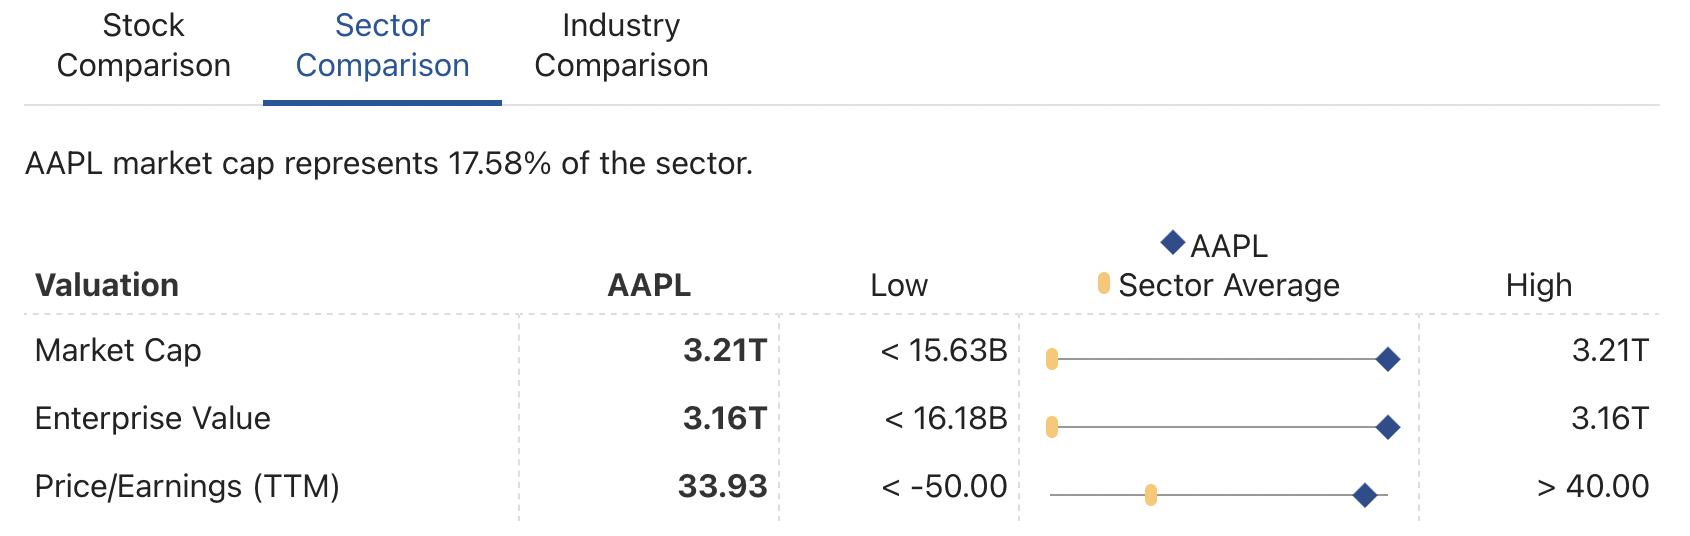
Sector Comparisons of Apple Inc.
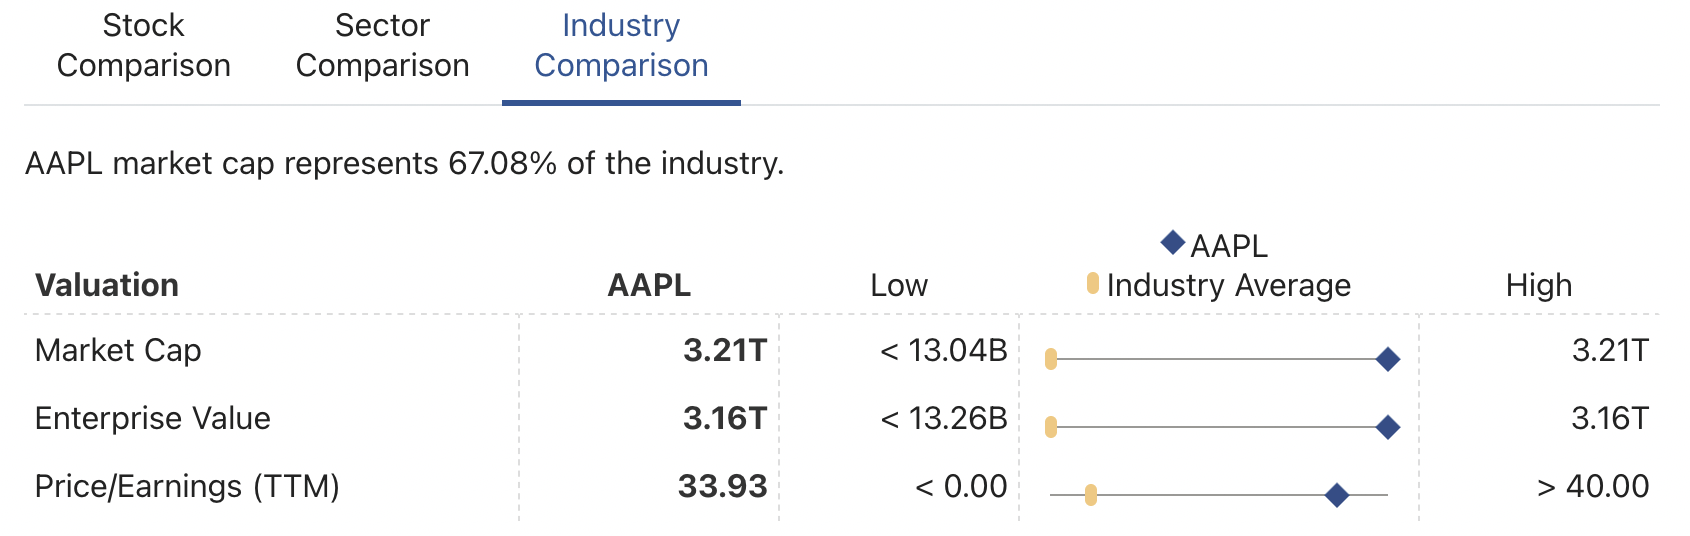
Industry Comparisons of Apple Inc.