Rubicon Technology, Inc.
RBCN
$5.32
-$0.48-8.28%
OTC PK
Key Statistics
Key Statistics — Unlock Critical Insights to Supercharge Your Investing
Get Key Stock Statistics Instantly
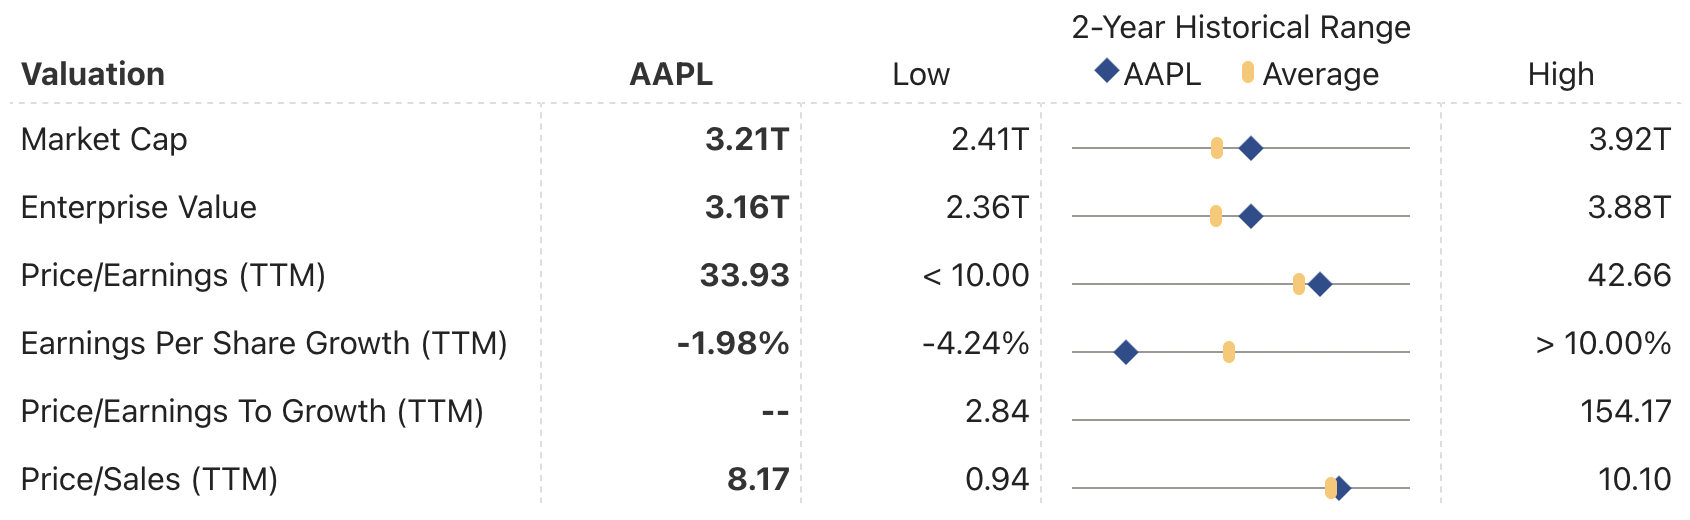
Gain immediate insights into the most critical data driving stock performance. Key statistics dives deep into the most comprehensive key metrics on a company — including profitability ratios, revenue growth, earnings stability, valuation measures and much more. Join Weiss Ratings Plus today and get deep, actionable intelligence required to outperform the market.
Sample Valuation Statistics for Apple Inc. (mid-March 2025):