TotalEnergies SE
TTE
$86.80
$0.570.66%
NYSE
Rating History
Unlock Rating History — Your Key to Predicting Stock Moves!
Unlock Rating History Now
See the entire ratings history of any stock — exactly when it was upgraded or downgraded, and precisely how the ratings changed over time.
Spot critical trends before the market does. Identify patterns, understand past performance when economic shifts happened and confidently assess future moves. Don’t invest blindly — unlock Weiss Ratings Plus today and get access to Ratings history to start making consistently smarter, more profitable investment decisions.
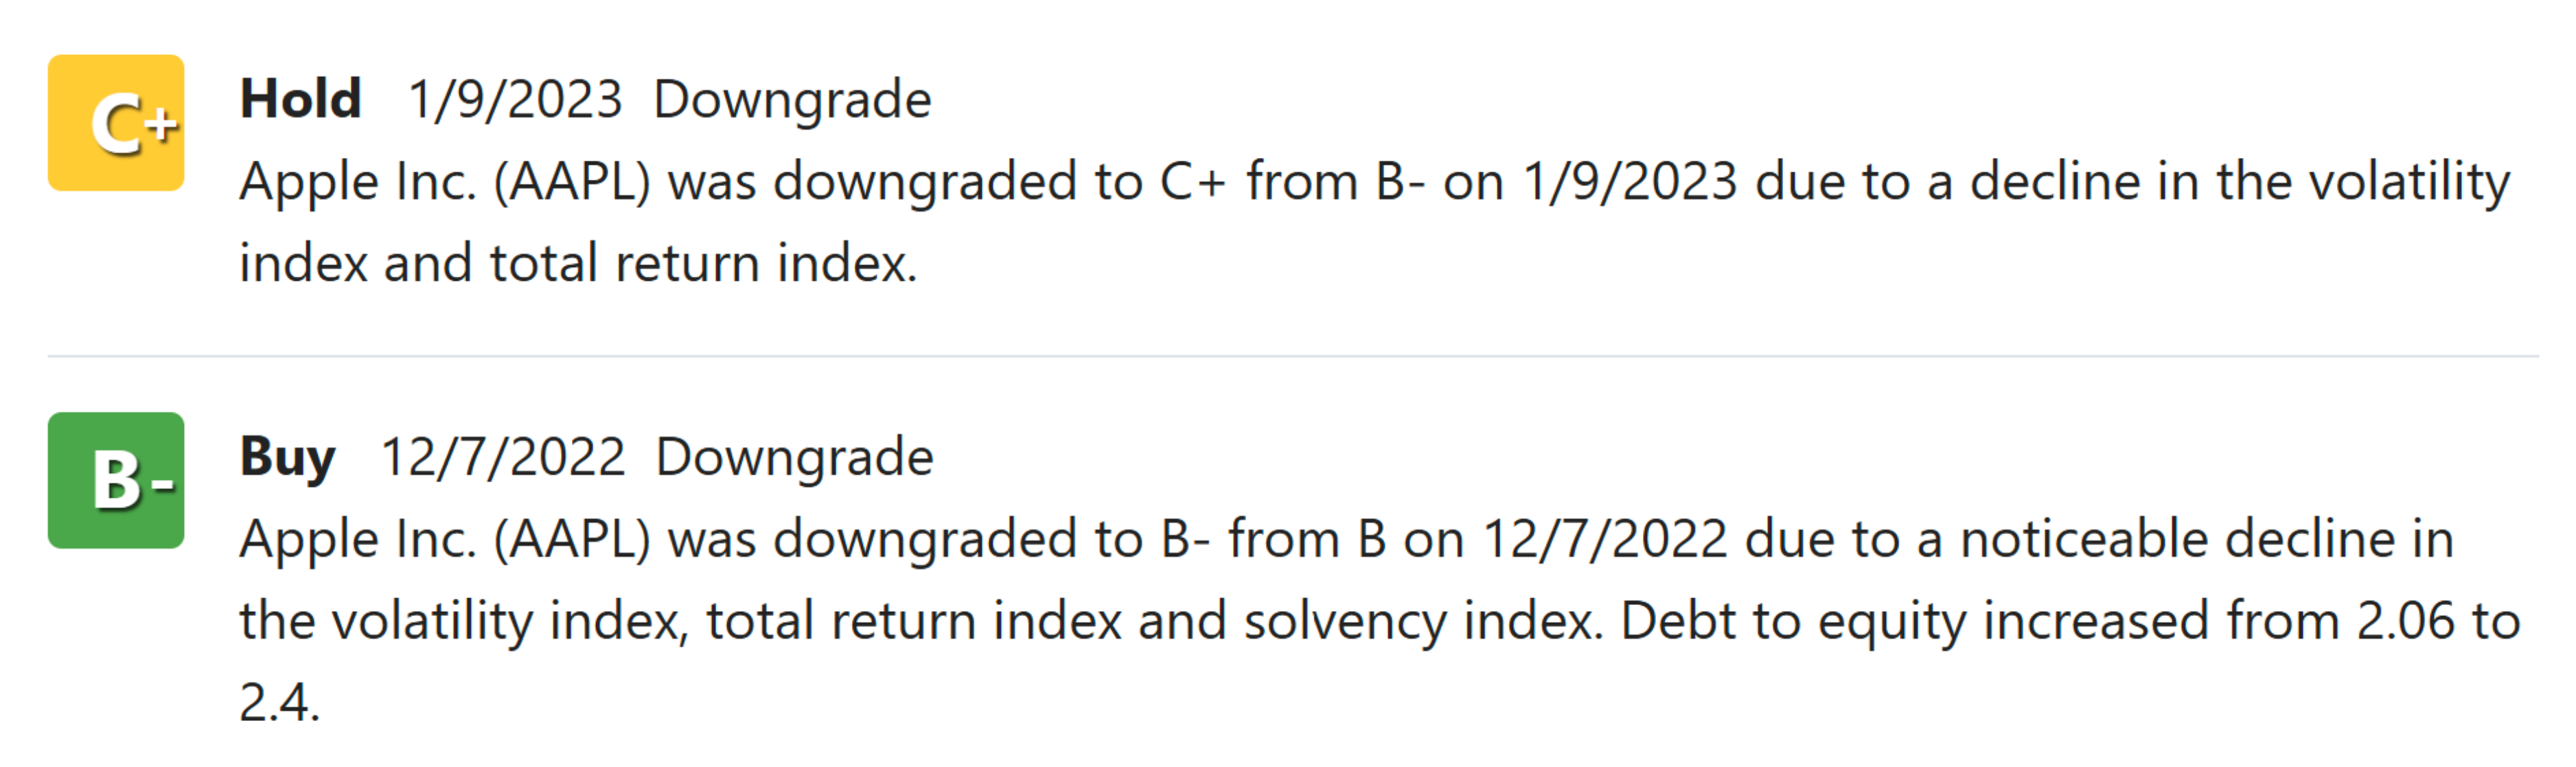
Sample of Rating History from Apple Inc. (February 2025):