In Saturday’s column, we talked about why President Trump’s decisions on trade tariffs and security are good for gold. You can read it here: “Cry Havoc! And Grab Gold.”
Last week, we saw gold post its biggest weekly gain since 2016. That’s what made me so bullish. My fear was I might be too early. That sometimes happens. I notice a trend develop and hop on it before the rest of the market wakes up and smells the coffee. We generally don’t want to hop on too soon. That can be just as painful as too late.
But gold surged to a five-week high on Monday. Sure, it will zig and zag. But I believe it’s likely heading higher.
Last week, we looked at the psychological reasons. To that, you can add the fundamental reasons of supply and demand. Indeed, here are two charts that show ETF investors are going long in a big way.
First, here is a chart of holdings in physical silver ETFs (white line) and physical gold ETFs (blue line).
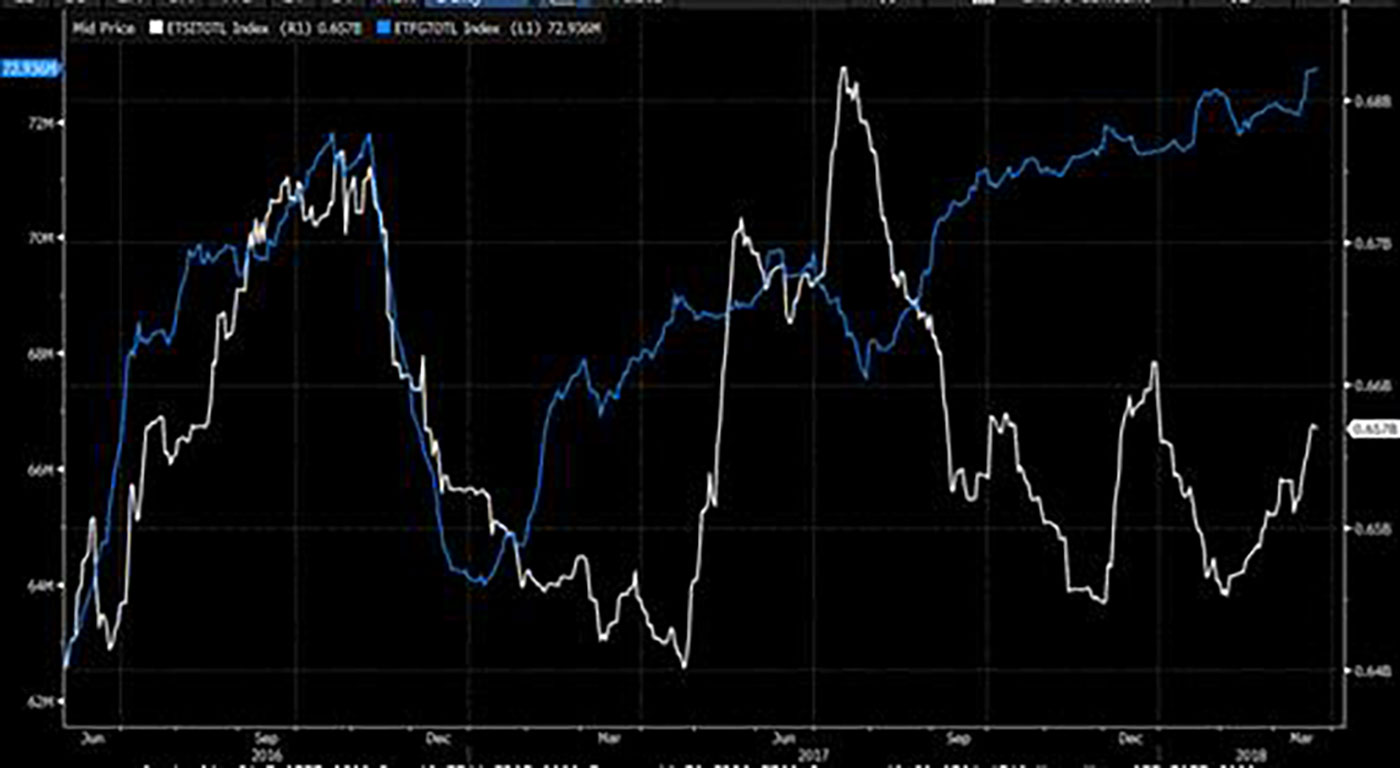
You can see that investors are piling into both. Zeroing in on gold, the latest numbers from Thursday show that gold ETF holdings of the metal stood at 72.9 million ounces. That’s the highest since May 2013.
Second, we can see that gold holdings in ETFs went up right as hedge fund managers’ holdings of gold went down.
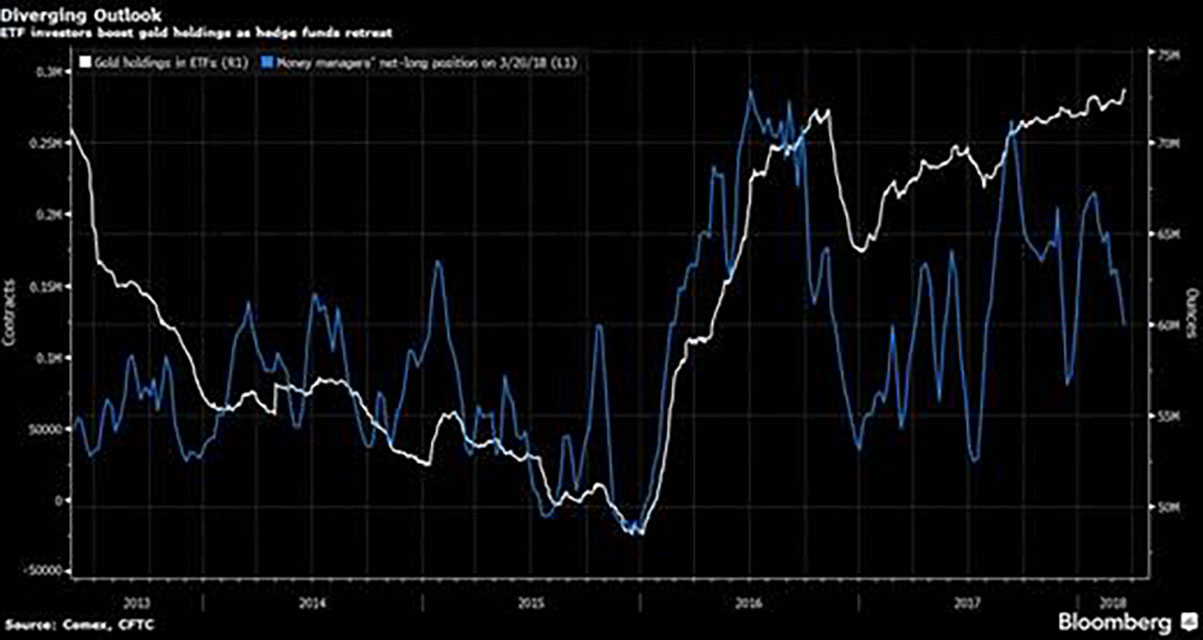
Here, gold holdings are the white line, and hedge funds are the blue line. Hedge funds are famous for doing the wrong thing at just the wrong time. So, kudos to Mom and Pop investors on that one.
That’s all short-term. So, for my third chart, well … you know me, and my long-term cycles and charts. I’m going to dust off a monthly chart of gold here …
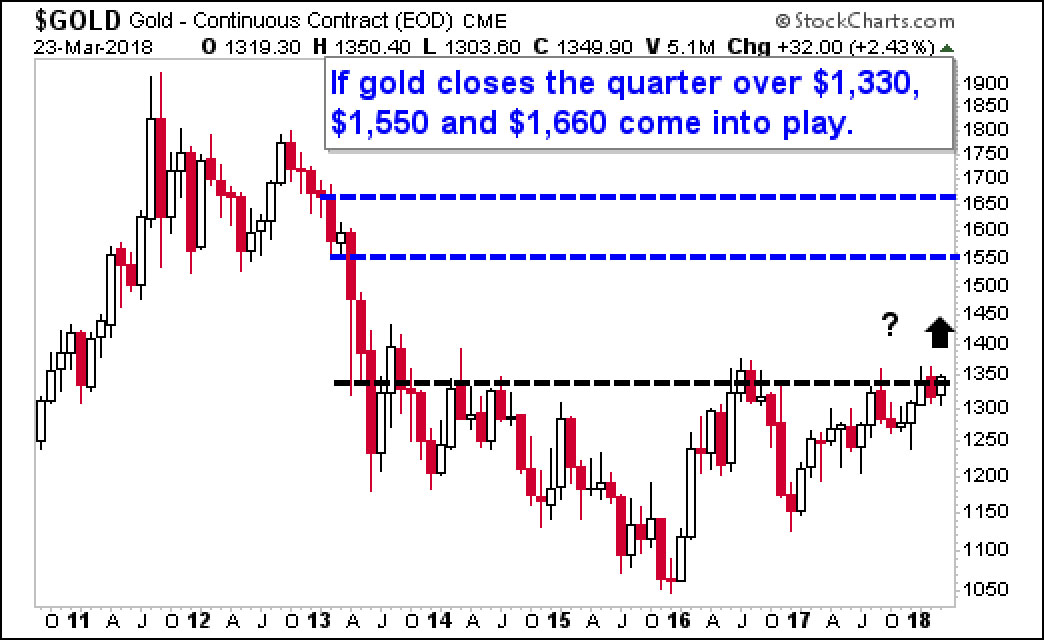
This week ends the quarter. And if gold closes this quarter above $1,330, that would be the first time we’ve had a quarterly close above that level since 2013. For technical traders, that would be like throwing red meat in a shark tank!
Now, will gold close the quarter above this level? I might be jumping the gun here. But:
• For all the trade and war reasons I laid out in my article …
• For the reasons of tightening supply and demand …
• For the reasons of investor psychology, which we can see in the ETFs …
… I think it’s a great time to buy the strongest miners.
Those miners are tracked by the two biggest gold miner funds, the VanEck Vectors Gold Miners ETF (NYSE: GDX) and the VanEck Vectors Junior Gold Miners ETF (NYSE: GDXJ). For a long time, these two funds underperformed gold. But on March 20, that all changed.
March 20 was when the miners started leaving the metal in the dust.
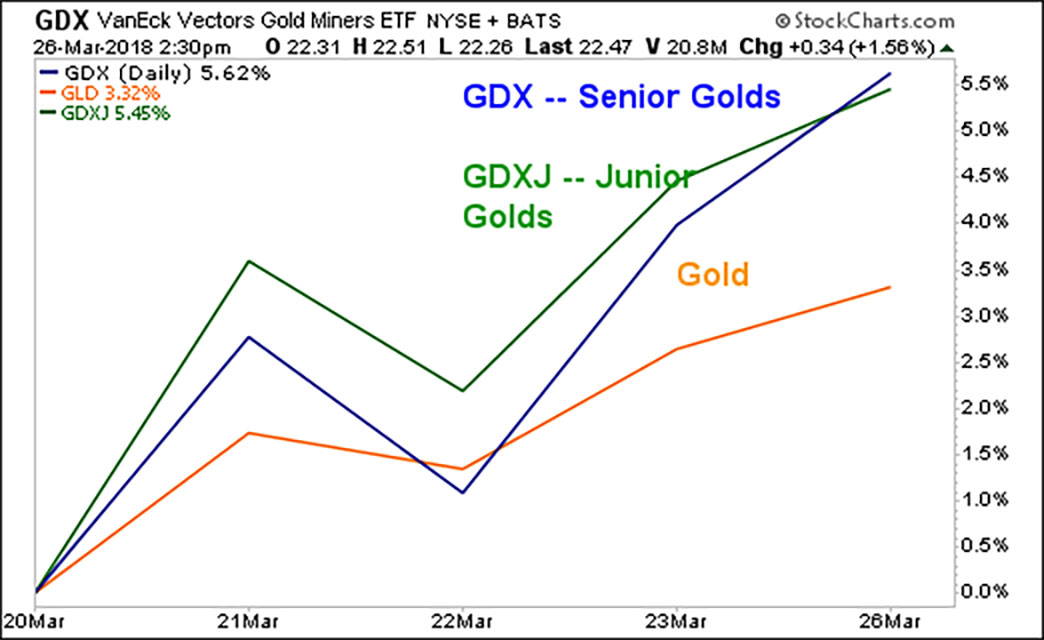
That’s the kind of action you expect to see in bull markets.
You can buy either of these ETFs and do well. OR, you can drill down, do your research, and buy individual names for even more potential outperformance.
Here’s what I did — I gave my Wealth Supercycle subscribers five gold miners that are on the launch pad. They are poised for outperformance. That’s on top of the three picks I gave them previously.
Do whatever suits you best. This profit ship is setting sail. Be onboard.
Best wishes,
Sean