I know many people are sure the U.S. and the world are about to slip into recession. But Doctor Copper would like a word.
They call copper the metal that takes the temperature of the global economy. And Doctor Copper says the economy isn’t cooling down, but rather, the global economy is heating up.
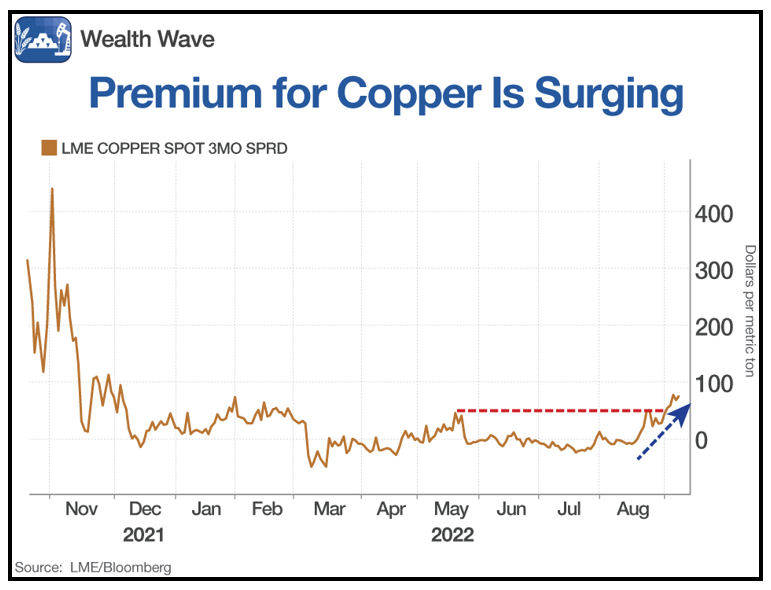
Let’s look at a chart of the premium that’s been paid for spot copper — in other words, immediate delivery — over the contract three months out. While it’s well off its highs of a couple years ago, it’s surging as of late:
Click here to see full-sized image.
Despite having a long way to go before returning to highs last seen in 2020, we can see this ratio is moving out of its usual range, having broken through overhead resistance at the beginning of September.
Back in 2020, the rise was driven by surging Chinese demand and tight supply. This time around, Chinese demand isn’t surging, but it’s steady. And that’s a bit of a surprise considering that China is locking down cities again due to COVID-19.
Chinese imports of copper are up 8.1% in the year to August, according to customs data. Meanwhile, China’s imports of crude oil and iron ore posted significant drops at the same time.
Part of it is due to the fact that, even though people in locked-down regions aren’t driving, factories are still producing, and workers are staying at factories to safeguard against infection.
But another part of it also has to be the demand — in China and around the world, for copper as an ENERGY metal.
Why?
Because electric vehicles can use up to three-and-a-half times the amount of copper compared to an internal combustion engine.
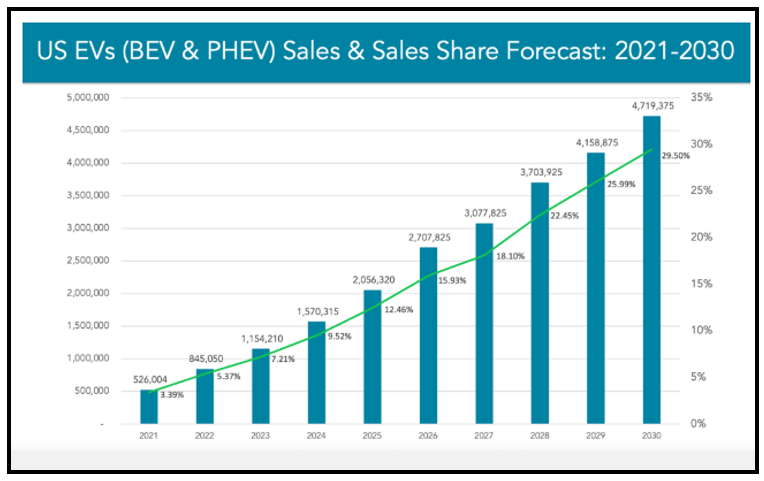
EV sales are red-hot and expected to get hotter, especially on the back of the incentive-laden Inflation Reduction Act recently passed by the Biden administration.
The number of EVs expected to hit U.S. roads grows to 20.6 million by 2025, up from 6.6 million in 2021, according to Bloomberg NEF. That equates to more copper use.
The Inflation Reduction Act is kicking America’s green energy initiatives into overdrive. It includes $260 billion in new and extended clean-energy tax credits meant to incentivize energy companies and public utilities to produce more solar, wind and hydroelectric energy.
Add to that individuals and couples who may be eligible for a $7,500 tax credit when they buy a new EV, or $4,000 for a used EV.
What’s this Mean for Copper?
On average:
• Solar energy needs 5 metric tons of copper to produce a megawatt of power.
• Wind farms require 4.3 metric tons.
• And offshore wind farms — which require very long cables — need 9.6 metric tons per megawatt.
On the supply side, a new report from S&P Global projects global copper demand to nearly double over the next decade, from 25 million metric tons today to about 50 million metric tons by 2035.
And the demand surge will be driven, in large part, by the rapid, large-scale deployment of technologies such as electric vehicles, charging infrastructure, solar PV, wind and batteries.
Importantly, growth in new copper supply capacity, from new mines or expansions of existing projects, will unlikely be able to keep pace with the surge in demand, the study says.
So, how will we bridge the looming gap?
Well, maybe we’ll find substitutes. Maybe we’ll find whole news ways to store and use energy. Most likely, there is going to be a massive shift upward in price.
But that’s down the road.
Copper, Recession & Opportunity
Let’s get back to now, to what the price of copper is telling us about recession.
Rising copper prices tell us that the odds of the U.S. going into recession in the next 12 months — currently predicted at about 47.5% — are probably too high. Sure, there is a risk of recession. But the odds favor growth, even if it’s low growth.
So how can you play this? Here’s an idea: Global X Copper Miners ETF (COPX) tracks a basket of 39 companies around the world that are involved in copper mining and processing. It has an expense ratio of 0.65%. Here’s a daily chart from the low in July — the same time that copper bottomed:
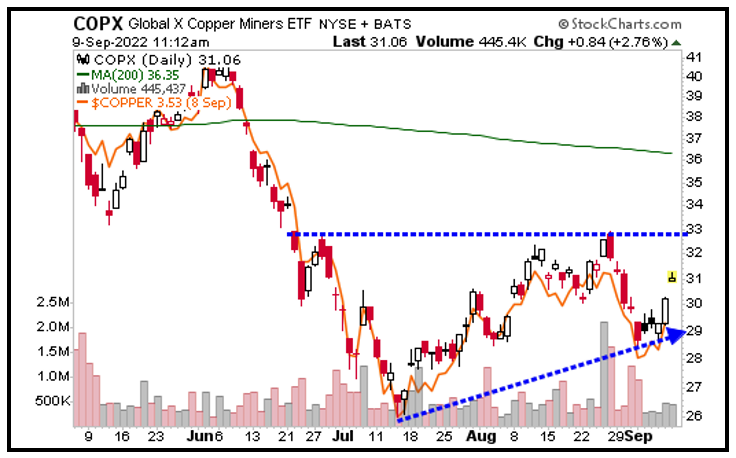
I’ve put the price of copper on the chart in orange so you can see that COPX follows the metal closely. COPX is in a rising wedge, as demonstrated by higher lows since bottoming in July.
If it can push above its recent high of $32.89, it should move quickly back to test its 200-day moving average just above $36. And if it can break out there, copper can go a lot higher.
We know that copper has excellent long-term prospects thanks to green energy and EVs. In the short term, despite worries about a recession, that’s a pretty attractive chart.
A rebound higher looks likely. Here’s a cherry on top of this sundae: COPX sports a dividend yield of 3.65%. So, you’ll be paid to wait.
If you want to enjoy the same kind of gains my Wealth Megatrends Members are currently enjoying, which are multiple double-digit gains while also being paid generous dividends in all positions, then you can join them by clicking right here.
As always, conduct your own due diligence before entering any trade.
All the best,
Sean