Gold ran up in the days ahead of the U.S. missile strikes on Syria, as the world held its collective breath against the manure hitting the fan. It turns out the missiles were on target, no one got killed, and the world breathed a collective sigh of relief. But you know what? Someone forgot to tell gold.
Gold is clinging tenaciously to those big gains it racked up last week. And for traders who are used to catching the falling balls as gold juggles its way through geopolitical events, this was a strange turn indeed.
So, you know who’s not buying the good news story? ETF investors. They’re buying both gold and silver hand over fist.
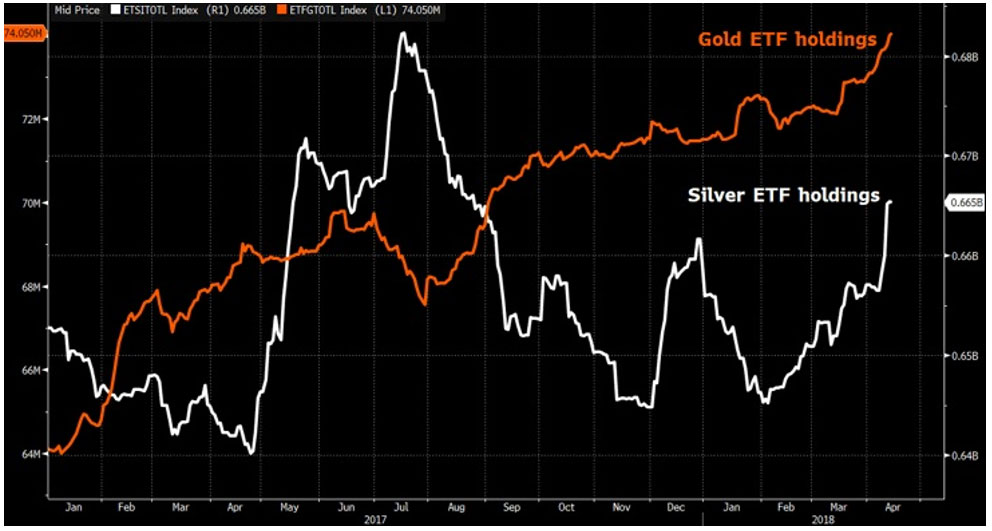
Indeed, exchange-traded gold funds recently added ounces for the eighth straight day in row. That brings this year’s net purchases to 2.55 million ounces.
Silver ounces are roaring near an 8-month high, at more than 665 million ounces.
So, what are ETF investors seeing that the market’s short-term timers aren’t? Maybe it’s the big picture. The big trend in gold. Take a look at this …
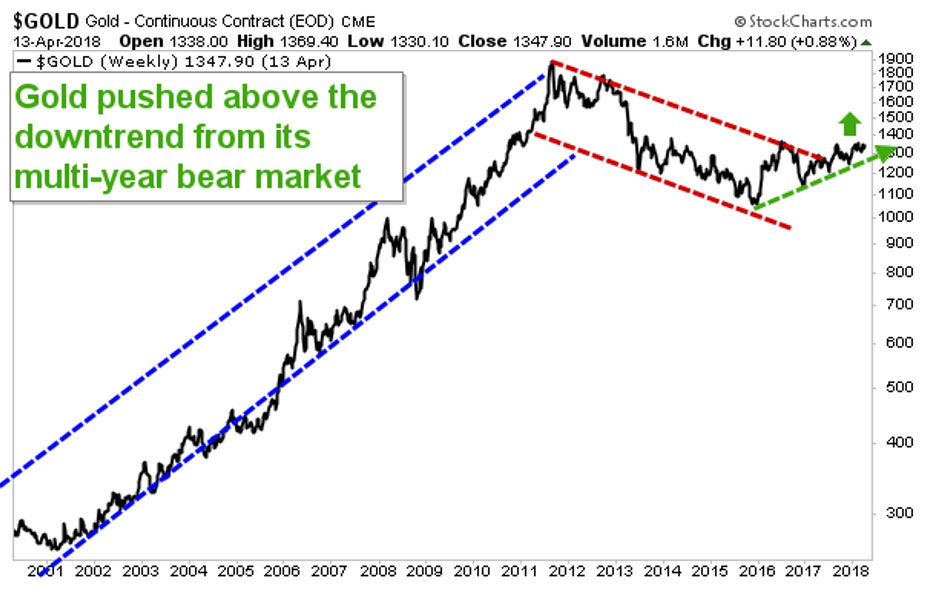
You can see that gold blasted higher from 2001 through 2011. Then it ran into the jaws of a bear market. Gold was in a bearish downtrend for years. Five, long, brutal years.
But in 2017, gold pushed above that downtrend. Now, after some consolidation, it appears to be ready to rocket.
I could list all the reasons why. Flat-to-declining supply. Falling ore grades. Booming demand on both sides of the Pacific from investors worried about a U.S.-China trade war. And more.
But let’s leave those details for another time. A question that might be on your mind, after looking at those two charts, is just how high could gold go?
Well, in its last big bull run, gold soared by 588%. Is that big enough for you?
How about nearer-term, though? I have one more chart for you …
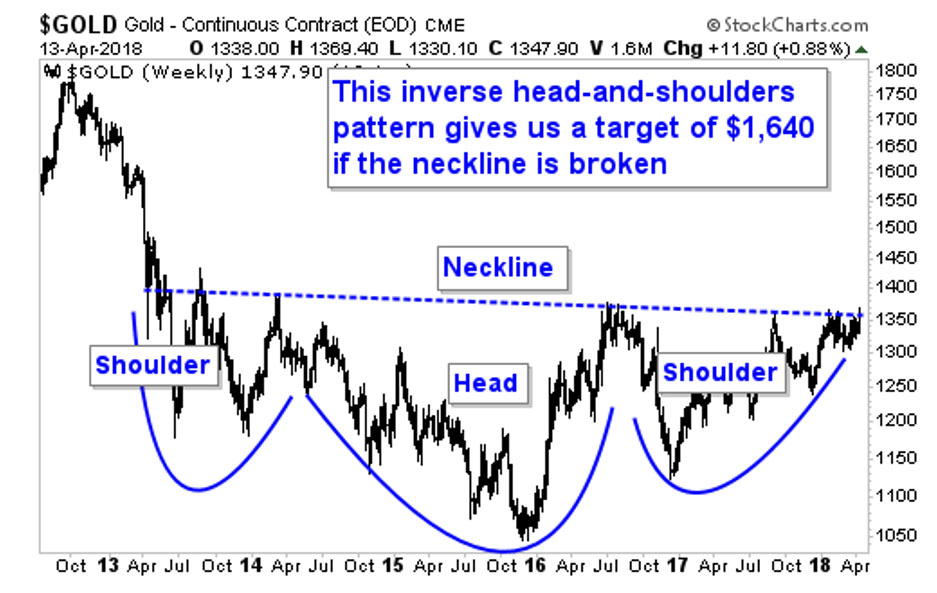
You can see that it has taken gold years to hammer out a classic “inverse head-and-shoulders” pattern. Chartists call it that because the price action looks like someone standing on his head.
If gold can break the “neckline” of that pattern, it gives us a target of $1,640. That’s SHORT-TERM.
And if gold is going to blast off like that, what do you think it will do to gold miners?
Think about it. Let’s say a gold miner can sell gold for $1,350 and mine it for an all-in cost of $1,000 an ounce. That’s a profit margin of $350 per ounce. Not bad.
So, let’s say gold goes to $1,640. That’s a move of 21.5%. Not bad!
But the gold miner’s profit margin goes from $350 to $640 for every single ounce pulled out of the ground. That’s an increase in the company’s profit margin of 82.9%!
That’s called leverage. And it means that gold may be going higher … but select gold miners are on the launch pad.
Many of those miners are tracked in the VanEck Vectors Gold Miners ETF (NYSE: GDX). You can just buy that industry benchmark. Or you can drill down and buy individual miners for even more leverage.
That’s what my Wealth Supercycle subscribers and I are doing. We’ve got a bushel of picks on the launch pad … ready to blast off. On the next pullback, we might buy more.
If you are trying this at home, alone, be sure to do your own due diligence.
The gold rockets are ready to fly. The countdown has started. Be ready. You don’t want to miss this one.
All the best,
Sean