Two Scorching-hot Charts – One Sizzling Investment Idea
Many analysts seem ready to stick a fork in wind and solar power.
After all, unlike coal and nuclear power, the Trump administration doesn’t seem to favor the alternative-energy segments. Plus, Team Trump is slapping tariffs on imported Chinese solar panels.
So you can see why the market is giving wind and solar some shade.
Let me show you two charts that might change your mind. Let’s start with wind and solar installations since the year 2000 …
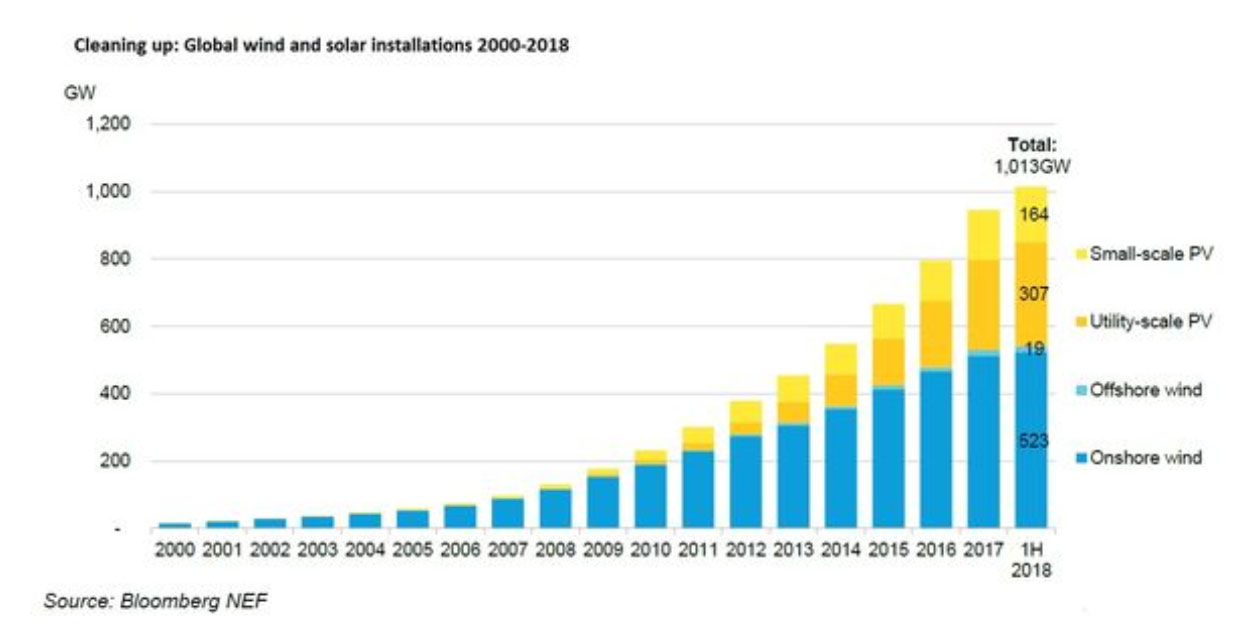
It took 40 years, but global wind and solar developers finally installed a trillion watts of power-generation capacity.
That sounds like a lot. And it’s a solid piece of Earth’s 6.2 terawatts of total power-generating capacity.
But here’s the best part: Experts say the next trillion watts of wind and solar could be installed in just the next five years.
Holy moly, that is explosive growth.
But we know the world is leaving the U.S. behind in the race for wind and solar. Asian nations put up 44% of new wind power, and 58% of new solar. China alone accounted for a third of that.
So the U.S. isn’t leading … for now.
That brings me to my next chart. This one is a bit closer to home …
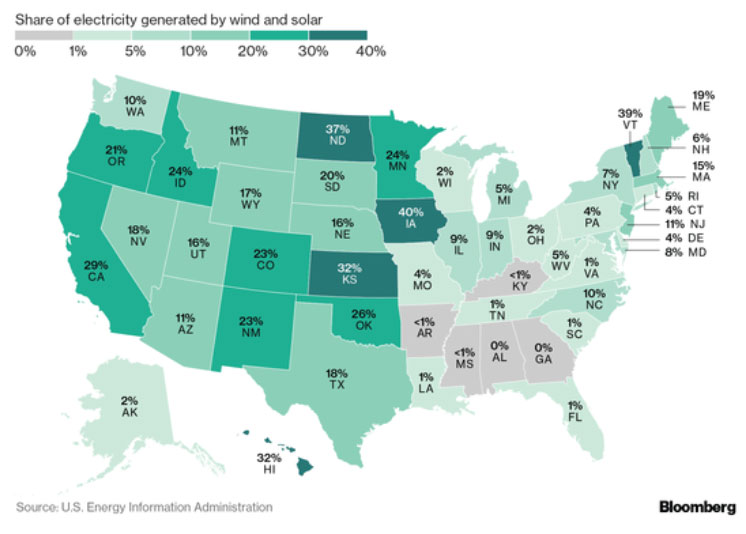
This chart from Bloomberg shows the share of electricity generated by wind and solar in each state. California generates 29% from wind and solar. That seems good, until you realize that North Dakota generates 37% and Iowa generates 40% from wind and solar. California, you’re ‘slackin’!
The real opportunity lies along the East Coast. Heck, New York generates just 7% of its energy from wind and solar. What, you think it’s too chilly and rainy there, and I’m being unfair? Vermont generates 39% of its energy from wind and solar.
And Florida — well, they don’t call it the Sunshine State for nothing. But it generates just 1% of its power from wind and solar.
Yeah, to me, it sure looks like the biggest opportunities for U.S. wind and solar are ahead, not behind.
How You Can Play It
I have a quiver full of great solar and wind companies that I’ll recommend to my subscribers as I see opportunities come along. And if you don’t want to do all the research on individual stocks — and take on single-stock risk — then you can buy an ETF. One idea would be the Invesco Solar ETF (NYSE: TAN).
TAN is trading near its 52-week low, confirming that the market does not like solar right now. And that makes it a fantastic play for a contrarian investor. Especially with global growth shifting into higher gear, and the best U.S. growth opportunities dead ahead. And 45.5% of TAN’s holdings are in the U.S. (25.3% are in China).
It even pays a 1.95% dividend yield. That’s one more reason to power up for the next big move in alternative energy.
All the best
Sean
P.S. I’ll be speaking at the San Francisco Money Show in August. It will be a great show, with all sorts of experts sharing their insights. You can find more about that incredible conference HERE. I hope to see you there!