2 On-Chain Metrics Show Signs of Recovery for Bitcoin
 |
| By Marija Matic |
Over the weekend, the price of Bitcoin (BTC, “B+”) continued consolidating near the resistance line of $26,800. It managed to break above it earlier today due to a surge in buy orders.
The daily BTC/USDT chart below shows the price breaking out of the (purple) channel and approaching a descending resistance (dotted line).
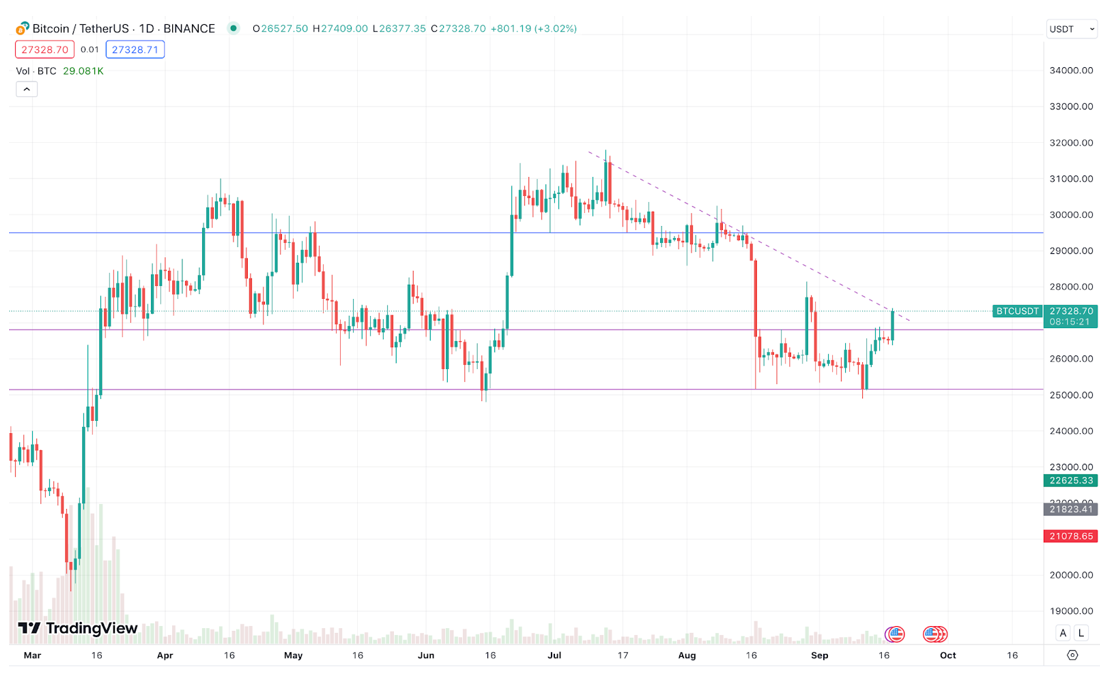
Prior to the break, open interest and the estimated leverage ratio were on the rise, signaling increased volatility ahead. It resulted in the squeeze and liquidation of roughly $40 million of shorts in just 12 hours as the price pushed up, leaving pessimists in the dust.
It would be very bullish if BTC manages to confidently hold above $26,800, as that would mean we could see $30,000 soon.
How soon? Maybe not as soon as you’d like. After all, the trading volume on exchanges is still negligent.
But a deeper look reveals that Bitcoin’s on-chain metrics are showing signs of recovery and strength in two main ways.
1. Rising On-Chain Activity
The Block data reveals that BTC now processes 560,000 transactions per day, a 118% increase from 257,000 transactions a year ago.
And it’s not just transactions going up. The number of new Bitcoin addresses opened daily has made a considerable jump in September. And the number of daily active addresses reached 1.1 million over the weekend — the highest number of active users in the past two and a half years!
Rising on-chain activity is partly due to the rising number of text-based inscriptions on Bitcoin and is demonstrating increased engagement with the cryptocurrency.
2. Number of Long-Term Holders Growing
Long-term holders — those who hold their crypto for over 155 days — now possess a staggering 70% of the total Bitcoin supply. Among these, 69% are currently in profit, reflecting a fairly comfortable position and expectation of higher prices.
With all these HODLers, there’s a lot of Bitcoin that hasn’t been active in a while. In fact, 40.67% hasn’t been active in at least 3 years! That’s an all-time high for the metric.
HODLers are resilient and patient, and their “hold the line” mentality is proving their faith in the bullish future for Bitcoin, even in this tumultuous transition year.
While short-term holders, aka weak hands, are selling and quitting the market, long-term holders, aka diamond hands, and big money continue building up their Bitcoin stores now, before the next bullish season.
But while Bitcoin has shown more strength in today’s break above its resistance, Ethereum (ETH, “B”) has struggled to follow suit. It’s currently hovering just below resistance at $1,660:
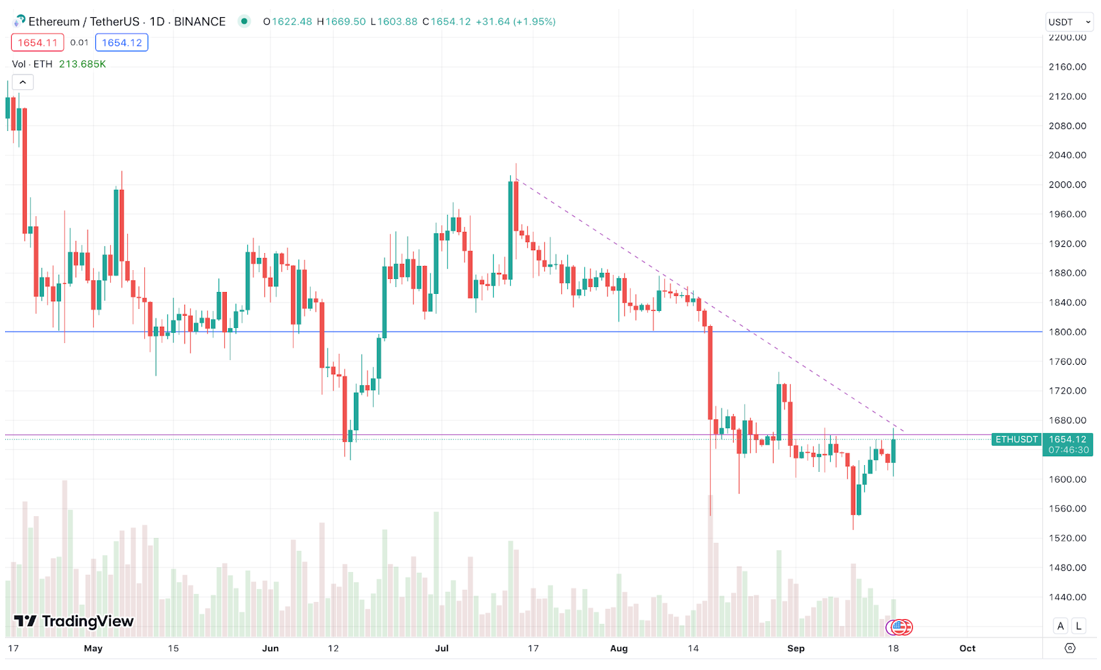
Moving and sustaining a position above this level would be pivotal to confirm Ethereum's bullish momentum.
Even better would be if ETH cracks above its late-August high near $1,720. That would be a stronger signal that an interim low for ETH was in place.
And fundamentally, Ethereum has several reasons to be bullish.
First, a year has passed since the Merge, which proved to be a great success. Without it, Ethereum would have consumed 0.2% of worldwide electricity. The Merge is also responsible for the supply decreasing by -0.249%.
To put that in perspective, for the 700,000 of new ETH that has been issued, 1 million has been burned, which means there was a 300,000 ETH net supply reduction.
Furthermore, mirroring the sentiment seen with Bitcoin, there exists a steadfast faith in Ethereum's future. This confidence is vividly reflected in the recently reached milestone as the amount of ETH supply last active 7 to 10 years ago surged to an unprecedented high of 5.16 million ETH, according to Glassnode data.
Just like with Bitcoin, ETH’s HODLers are holding tight to their crypto because they believe in its future.
Notable News, Notes & Tweets
- New York regulator will require higher standards for coin listings and delistings.
- Nine U.S. senators publicly back Sen. Elizabeth Warren’s (D-MA) crypto bill.
- Deutsche Bank makes major U-turn on crypto.
- Approximately $50 billion worth of Bitcoin are now held by ETFs, countries and companies.
- Miner returns over $500,000 in BTC to Paxos after the company mistakenly overpaid the transfer fees.
What’s Next?
Surprisingly, Bitcoin is defying historical trends and experiencing a green September. BTC's attempt to rise and maintain levels above $26,800 raises optimism that the worst may be behind us.
Notably, a brief dip below $25,000 last week, followed by the success of breaking past $27,000, suggests a potential shift in favor of bulls, but we’ll have to wait and see what the remainder of week brings.
Ethereum's today's try at the $1,660 resistance only adds to the bullishness.
Additionally, the rising number of active users and new Bitcoin addresses, along with Ethereum's net supply reduction and the increased number of long-term holders, indicate stronger fundamentals.
While market dynamics can change rapidly, looking ahead, October typically emerges as a favorable month for Bitcoin. This historical pattern adds to the positive sentiment surrounding BTC's short-term prospects, in addition to potential spot ETF approval in mid-October.
However, in the shortest term, market participants are redirecting their attention toward the upcoming Federal Reserve monetary policy meeting, eagerly anticipating the release of key trading signals.
So, hold tight and keep checking back here daily for updates on those short-term developments.
Best,
Marija