 |
| By Juan Villaverde |
Bitcoin (BTC, “B+”) has been relatively stable over the past couple weeks — a welcome departure from the brutal cascade of selling that started in mid-January.
But while the panic may have subsided somewhat, anxiety still runs high, especially among the recently shell-shocked. Which, I daresay, includes the vast majority of market participants and observers.
Indeed, the question I’m most often asked is: “Is everything on track? Are we finally heading higher?”
The short answer: Yes, everything remains on track.
The longer answer is somewhat more nuanced. Because my model and early indicators point to two possible scenarios for Bitcoin’s next rally.
But first, a reminder of something you must always keep in mind: “All models are wrong. But some are still useful.”
Nothing I say here is gospel. Markets can — and often do — deviate from even the best forecasting models, even if only temporarily.
With that in mind, let’s revisit …
The Bond/Liquidity Forecast:
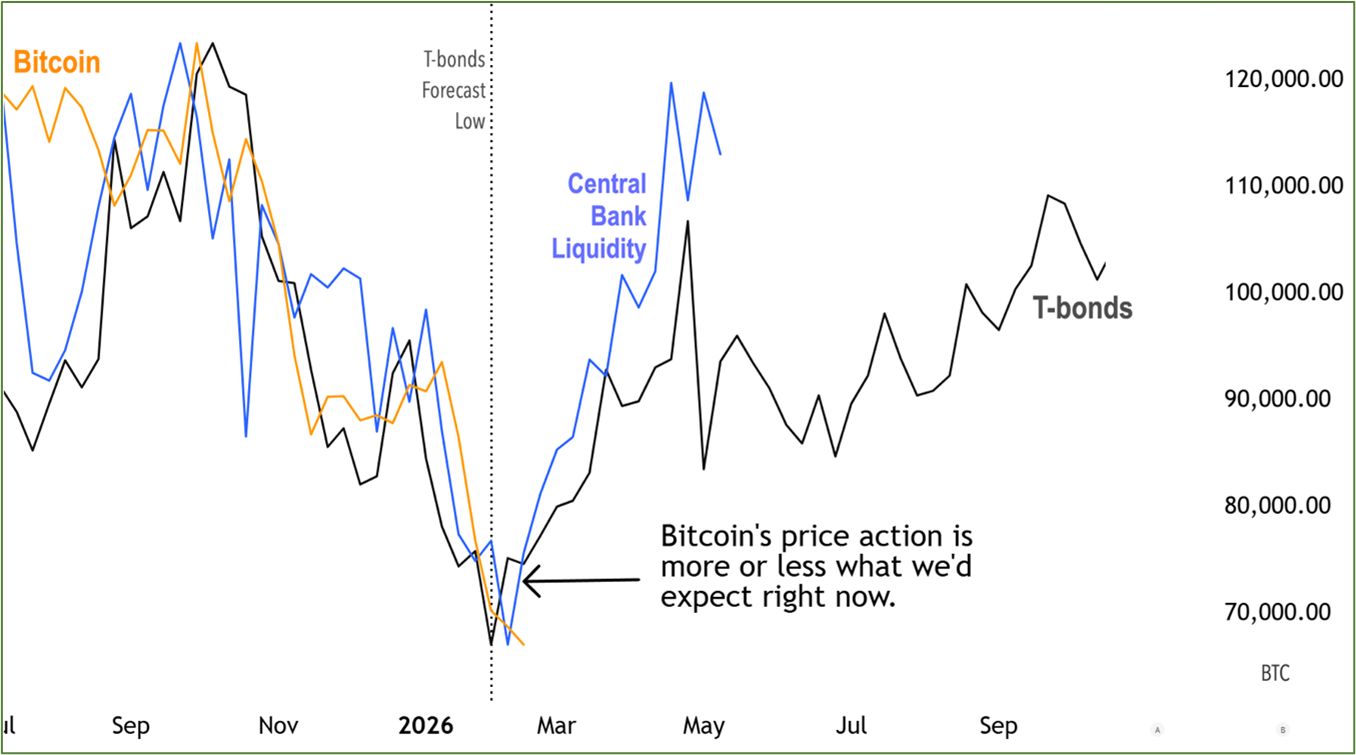
As you can see, we remain well within the margin of error for Bitcoin to establish a key 320-day-cycle low.
The weekly structure suggests Bitcoin likely made that low during the week of Feb. 2 — specifically on Feb. 5. That aligns closely with the bond markets’ forecast (marked by the black dotted vertical line).
Bitcoin only appears to be making a “new low” recently because this chart shows weekly closes. And technically, last week’s close was slightly lower. But that’s splitting hairs.
It’s completely normal for prices not to align exactly with model forecasts. The timing can be off a few weeks in either direction — that’s the margin of error inherent in the model.
And after so many weeks of relentless selling, it’s perfectly reasonable for the market to consolidate in the $65,000–$70,000 range for a time.
From a timing perspective, however, it is now time for Bitcoin to start turning up. If — that is … Feb. 5 was indeed the 320-day-cycle bottom.
As we approach the final week of February, my model says Bitcoin should clear $70,000 and begin showing signs of a new cycle rally.
There is, however, a further chapter in this story.
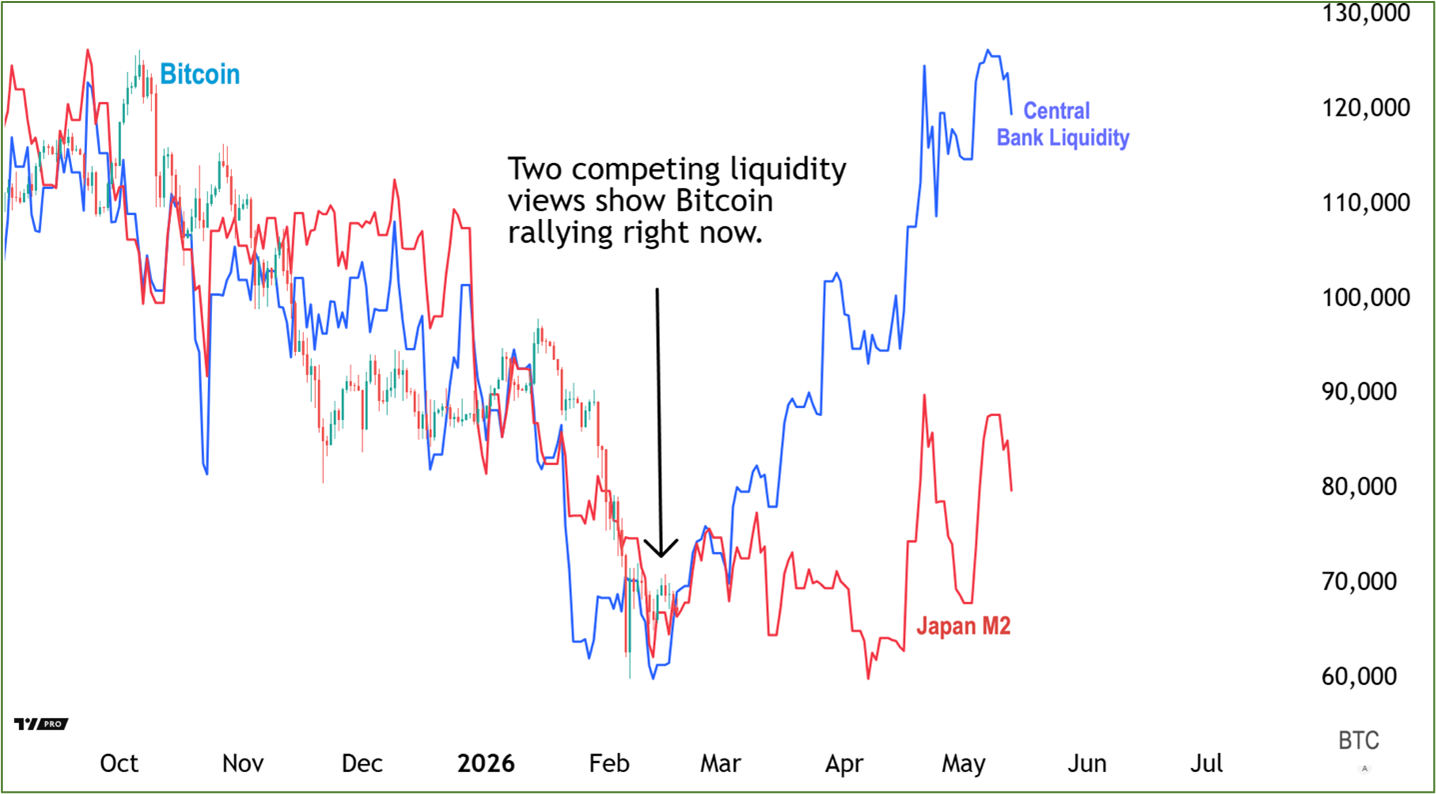
Japan M2 Also Supports an Imminent Rebound … with a Twist
To be clear:
- Both indicators show Bitcoin establishing a mid-February low.
- Both suggest Bitcoin should be rallying right about now.
- Both indicate this rally should begin accelerating into next week.
Where they differ … is what happens after that.
CBL points to a powerful rally beginning soon. One that continues largely uninterrupted until Bitcoin closes in on $100,000 in late April or early May.
JPN M2, however, paints a more muted picture.
It anticipates Bitcoin will struggle within a range. There is a chance it may be unable to break meaningfully above $75,000 by mid-March.
From there, we could see another correction before Bitcoin rallies again into May where it’ll likely top out near $90,000.
To recap, CBL anticipates strength. JPN M2 points to stabilization and grind. But both suggest a price recovery from here.
The differences though are enough to impact targets for traders. And if we do have another correction, that could prove a useful entry for long-term traders, as well.
Which is why I wanted you to see this divergence as soon as possible. You’ll want your strategy set before Bitcoin’s run begins.
And don’t dismiss JPN M2 as an indicator lightly.
It has demonstrated predictive value before. And it’s warning that the coming rally could be slower and less explosive than Central Bank Liquidity alone might imply.
To recap: No liquidity metric I track is pointing toward further systemic collapse.
At minimum, both indicate stabilization: One points toward $100,000 by April. The other points lower, near $90,000.
Most likely, reality will land somewhere in between.
Best,
Juan Villaverde
P.S. To get even more insights from my Crypto Timing Model, click here.
