3 Indicators That Say Crypto’s Correction Will Be Mild
 |
| By Juan Villaverde |
Today’s trading has continued Bitcoin’s (BTC, “A-”) correction.
At the time of writing, the OG crypto is now near $82,500.
So, what happened?
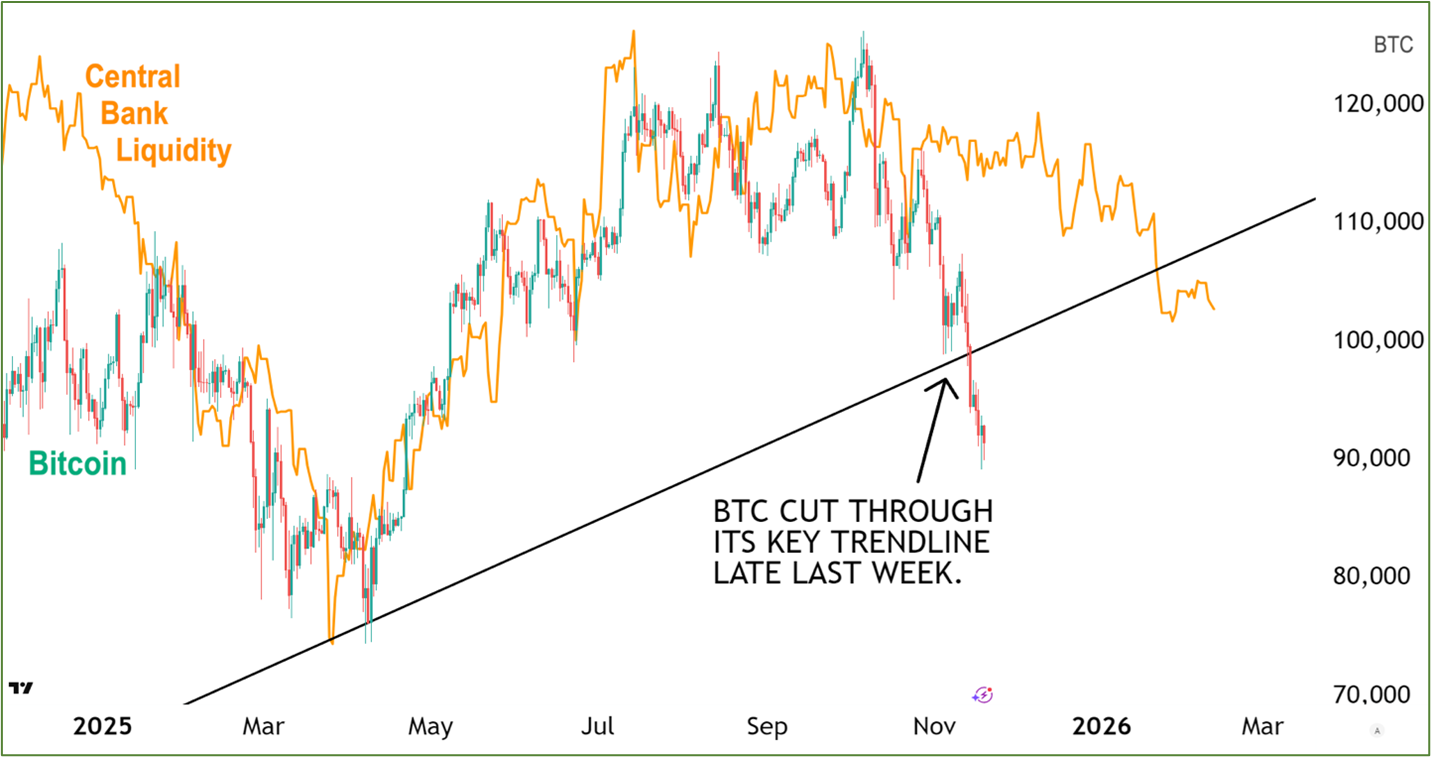
Well, after months of acting as strong support, the $100,000 level quickly gave way — almost as if it weren’t a key psychological barrier at all.
That threshold (shown below) is the black uptrend line connecting Bitcoin’s last two 320-day-cycle lows: Sept. 6, 2024, and April 7, 2025.
Bitcoin sliced through it like a hot knife through butter.
By doing so, it has confirmed its 4-year cycle high was made on Oct. 6 at $126,080.
This has been, by far, the biggest development in the past seven days.
Because it reinforces that crypto’s 4-year cycle decline is now underway.
Some less disciplined crypto investors may be prone to panic at this confirmation.
But I have faith you won’t be one of them.
I for sure won’t be.
That’s because I see three very bright reasons to be optimistic. And they all point to one key takeaway …
This correction will be mild compared to cycles past.
3 Reasons I See a Mild Correction Ahead
- The 4-year “decline” does not mean Bitcoin will fall for four years.
Far from it. The “four-year” timeframe merely refers to crypto’s longest cycle — roughly four years in duration.
The current one began in November 2022 and is scheduled to end in November 2026.
The worst-case scenario for what comes next? Roughly 12 months of falling crypto asset prices. But even this degree of weakness is rare.
Just about every 4-year cycle decline can be broken down into about six (or fewer) months of downside, followed by roughly six months of mostly sideways price action.
In 2018, for example, Bitcoin fell from mid-December 2017 through early February 2018 … before it moved sideways into mid-November 2018. Then came a month-long drop into its final, 4-year cycle low (the bear-market bottom) in December 2018.
So, you see, most of the entire “bear market” … consisted of sideways chop.
The last bear market (2022) was far worse in terms of duration. It went from an early November 2021 high … to a 320-day cycle low in mid-June 2022. Bitcoin fell about 70%, similar to the early 2018 decline. It just took a lot longer.
Why the difference?
Most likely because Bitcoin’s meteoric ascent into its 2017 high was a true “blow-off” top.
By contrast, the November 2021 high was relatively tame — essentially a double-top paired with an April 2021 320-day cycle high.
- Cycles like symmetry.
The faster the move up, the faster the move down. And vice versa.
So if you have a slow, muted rally higher … you can expect a slow, muted correction.
This is crucial to understanding what comes next.
Bitcoin was nowhere near as overbought in October 2025 as it was near its 4-year cycle top in 2021, let alone 2017. Indeed, there was no runaway up-move in 2025 at all.
Bitcoin started the year at roughly $90,000 and topped out at $125,000. For crypto, that’s almost a sideways year.
And a sideways move up like that implies a sideways move down. Because cycles like symmetry.
As such, I don’t expect BTC to bleed as heavily in this cycle correction.
- Central Bank Liquidity’s 2026 outlook is mildly positive.
Take another look at Figure 1 (above). Observe how well falling liquidity explains the decline we’re now witnessing.
At the 4-year cycle tops in 2018 and 2022, liquidity conditions were decisively bearish. That was especially true in 2022.
That’s why the ensuing decline lasted so long.
Now, here’s where things get strange …
Throughout the entire 2022-2025 bull market, liquidity was barely lukewarm at best. In fact, CBL is actually lower today than three years ago!
This is why Bitcoin did not have its typical parabolic run-up. There just wasn’t enough liquidity to support one.
But now that we’re in the early stages of the 4-year cycle down-phase, the outlook for CBL is actually mildly positive.
Just as lower liquidity can stifle an otherwise strong bull market, what do you think will happen in a bear market with improving liquidity?
Answer: We get a weak one.
So, am I expecting an 80% decline? Nope.
Nor do I foresee a fast, 70% waterfall drop over the next few months.
Here’s what I do expect: Downside pressure will last until the next liquidity bottom — likely in Q1 2026.
After that, the price action should be mostly sideways: big rallies, big selloffs, no clear direction.
For traders, this means your time to sit on the sidelines is limited. And you’ll want to have your “neutral” market strategy ready to go once Bitcoin begins its sideways crawl.
For long-term investors, patience and sticking to your strategy will help you stay steady through the storm.
Best,
Juan Villaverde
P.S. Both TradFi and crypto darlings can fall victim to market volatility that drags down even the strongest projects.
But my colleague Chris Graebe focuses on private equity opportunities that are insulated from the market’s slings and arrows.
That’s not to say there isn’t risk. But with the right due diligence, you can find incredible prospects.
Chris himself has put money into over 30 startups valued at just a few million dollars in total when he first invested. Today, they’re worth a combined $1 billion and counting — including the ones that didn’t work out.
And on Tuesday, Nov. 25, Chris will host his $706 Billion Private Deal Briefing.
In it, he’ll explain how you can get into startup investing and target an Alpha Round opportunity that could RAPIDLY disrupt three fast-growing biomedical markets valued at over $700 billion.
It’s free to attend. Just click here to save your seat.
