 |
| By Juan Villaverde |
For weeks, I’ve zeroed in on how global liquidity affects crypto asset prices.
Broadly speaking, liquidity represents the supply of money and credit circulating around the world.
We also live in an era where most governments run perpetual deficits. They borrow year after year with no intention of ever repaying their debt.
When liquidity goes up, more money is circulating. That debases the value of money itself.
Bitcoin is a hedge against debasement.
So, its price rises whenever more money is created.
We know this to be true.
I’ve created models that prove, beyond a doubt, that money-printing is a key reason Bitcoin and other cryptos move higher.
What’s more, my research shows that growing global liquidity (i.e., money-printing) precedes Bitcoin rallies by exactly 88 days.
That’s about three months.
This is not a new development.
It has been the case since Bitcoin first began trading in public markets back in 2010.
And this phenomenon is unlikely to change anytime soon.
Neither is the fact that liquidity metrics can be a bit nebulous.
Sure, you can ask Google or your favorite chatbot where it stands today. But the answer will likely be incorrect or, at least, incomplete.
Still, the question of:
What is the best liquidity indicator to use?
Has been bugging me lately. Here’s what I’ve found out …
The 2 Sources of Money-Creation
Private credit: the liquidity that’s created by privately owned institutions (primarily banks) in a fractional reserve banking system. This is done through making loans.
Central bank liquidity (CBL): the money that central banks create.
Global M2 is the broadest measure of money. It captures the total liquidity created by both central and commercial banks.
Over the last 15 years, M2 has been the main driver of Bitcoin and crypto prices. And it explains about 99% of Bitcoin’s price movements.
Normally, if central banks are printing money, commercial banks are also creating liquidity. And vice versa.
So, they almost always move together.
But here’s the rub.
There are still times — like now — when they do not.
Private Credit & CBL Diverge
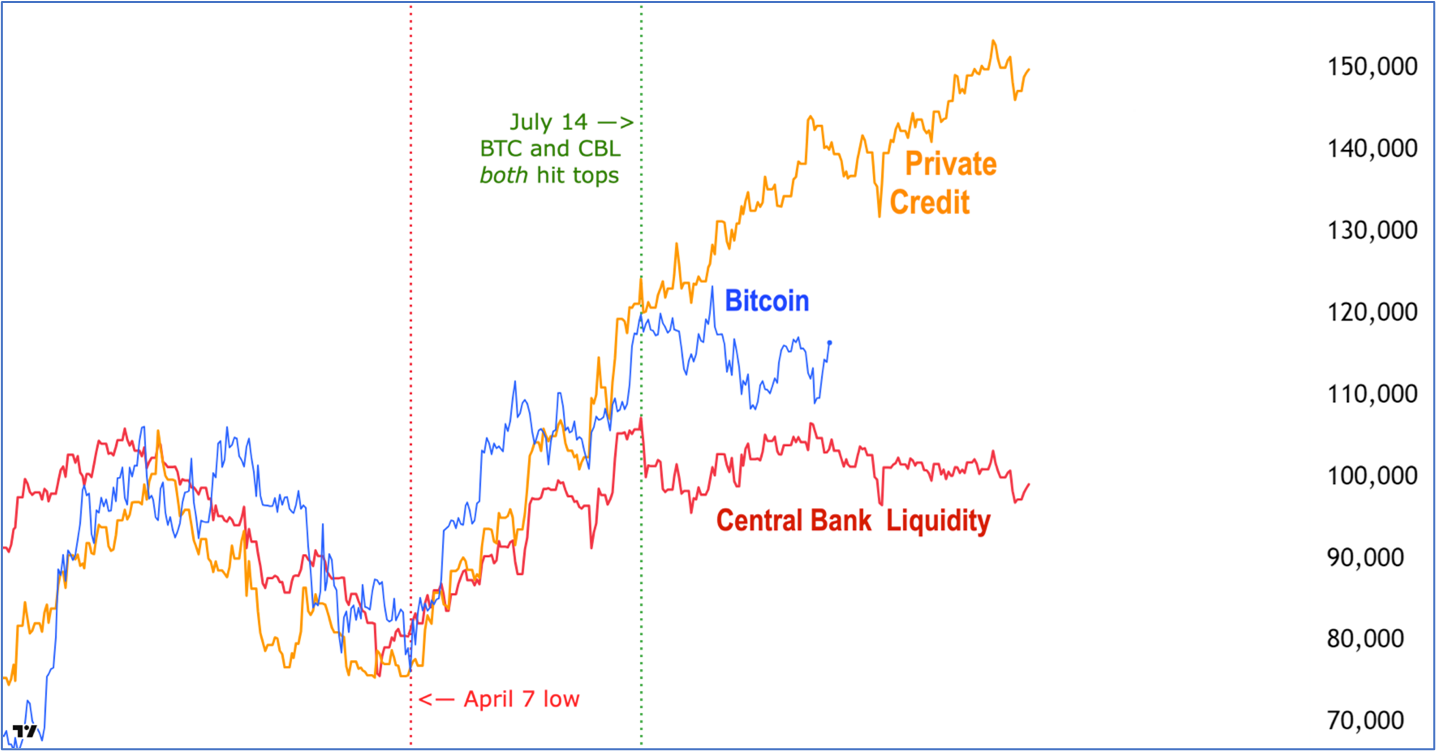
As you can see, all three lines were moving roughly together — that is, behaving normally — right up until April 7 (the red vertical dotted line).
That was just after the “Liberation Day” tariffs were announced.
Soon afterward, all these lines began to decouple.
- Private Credit surged higher, leaving first CBL and then BTC behind.
- Later, CBL topped out around July 14 (the green vertical dotted line).
- So did Bitcoin.
No question about it: Bitcoin is now stuck in the mud because Central Bank Liquidity is stuck in the mud.
CBL shows no signs of life for at least the next 88 days.
That makes it likely Bitcoin will do the same. As indeed it already has the last few months.
Yet, historical data shows that over time Bitcoin follows Global M2. This has led many to argue that Bitcoin must be headed for a powerful “catch-up” rally. To restore the canonical BTC-M2 alignment.
I see the rationale. But I don’t share that view.
In my research, I found only a single isolated case where CBL deviated so much from M2: the fourth quarter of 2021.
Back then, as now, the divergence started in late August. That was the end of the last bull market.
Am I calling for the end of this bull market? That’s the question I keep getting asked.
The short answer is, “No.”
However, a very rare divergence is still occurring. And finding out what’s causing it could yield important clues about what crypto is likely to do next.
Something — or someone — is sucking up a lot of money from around the world. The last time this happened, global markets — including stocks and crypto — made major highs.
I’ll have lots more to say about this in my upcoming briefing on Tuesday, Oct. 7.
That’s when I’ll break down what my upgraded Crypto Timing Model 2.0 shows is on the horizon …
And how you can make the most of this divergence.
It’s free to attend. Just be sure to save your seat now.
Best,
Juan Villaverde
