 |
| By Juan Villaverde |
After bottoming alongside the Japanese M2 (JpM2) liquidity indicator on June 5, Bitcoin (BTC, “B+”) bounced about 10%.
I said at the time this minor move would soon fade. Now, it has.
After briefly poking above $65,000, Bitcoin settled back to around $59,000, where it sits, as I write.
This has the uninformed panicking. Already, the Fear & Greed Index has slipped into “Extreme Fear.”
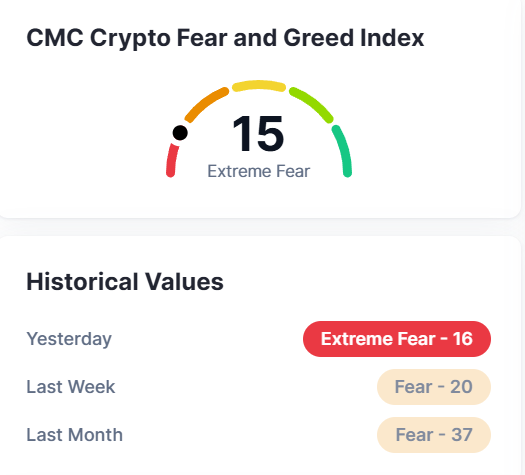
But I’m not worried. Because this is exactly what I expected to play out.
Both liquidity indicators I rely on — JpM2 and Central Bank Liquidity (CBL) showed a retest of the June 5 low was likely this week.
That level sits just above $58,000. So all that’s happening right now is downside support is being tested. Just as you’d expect when the market is looking to confirm a low.
In fact, Bitcoin is behaving exactly as JpM2 suggested all along. Only now, the bigger picture is starting to come into sharper focus.
But sadly for anyone very impatient to jump on the next bull market, it looks like we may have to wait a while longer.
CBL and JpM2: Closely Aligned Again After July 23
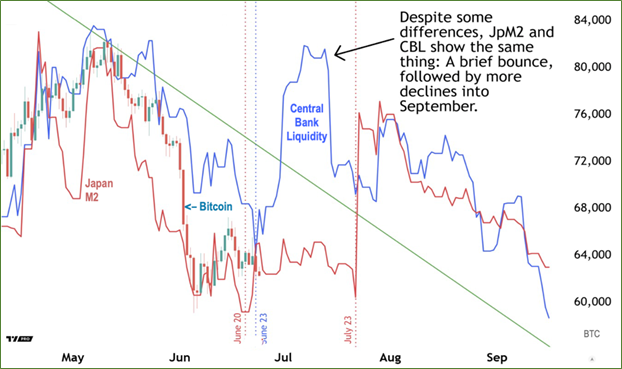
This chart shows Bitcoin alongside CBL and JpM2, starting from the late April/early May top. Between that top and early September — where the chart ends — both liquidity indicators are once again aligned.
The only point of disagreement is right now: the late June bottom. Marked by both the red and blue dotted vertical lines, you can see that CBL shows a meaningful bounce, but JpM2 does not.
Based on how Bitcoin has responded this year, and the macro environment we’re currently in, I strongly believe BTC will follow JpM2.
After this June bottom, though, both indicators show basically the same thing: After a local high in July, both fall into early September.
Here’s how I believe we’ll see this play out in terms of price: Bitcoin is due for a bounce soon. But it likely won’t be significant in terms of gains or length.
Then, prices are likely to consolidate further into the third quarter.
There is some minor disagreement between the two: CBL shows the Bitcoin rally happening now, whereas JpM2 places the bottom on July 22, with a rally happening after. (See the red dotted vertical line.)
But the conclusion is the same either way: A modest rally — either now or in late July — followed by a renewed decline into September.
Whichever indicator you may favor, the message is clear: Bitcoin is still not ready for prime time.
The good news is that neither liquidity indicator shows new lows or an ongoing crash. In fact, both point to sideways-to-higher prices heading into late July.
We Still Have At Least One More Low Before Prime Time
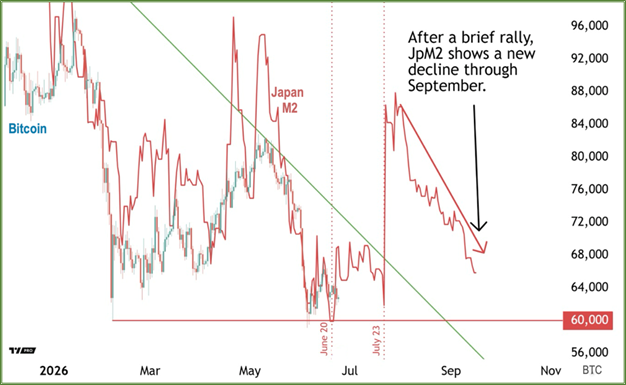
This zoomed-out chart shows just Bitcoin and JpM2. As you can see, Bitcoin found support at the Feb. 5 low, near $60,000 — as expected.
That level was also tested on June 5 and held. Not only that, but prices rallied smartly from there. Now, that level is being tested again.
But as I said above, it does not change the view from JpM2. Or CBL for that matter.
What does concern me, however, is the red down-pointing arrow toward the end of the JpM2 line. JpM2 has been declining for months with no sign of recovery.
At some point it will pick up steam again. And when it does, that turning point will likely mark Bitcoin's next important low. After the upcoming June/July one.
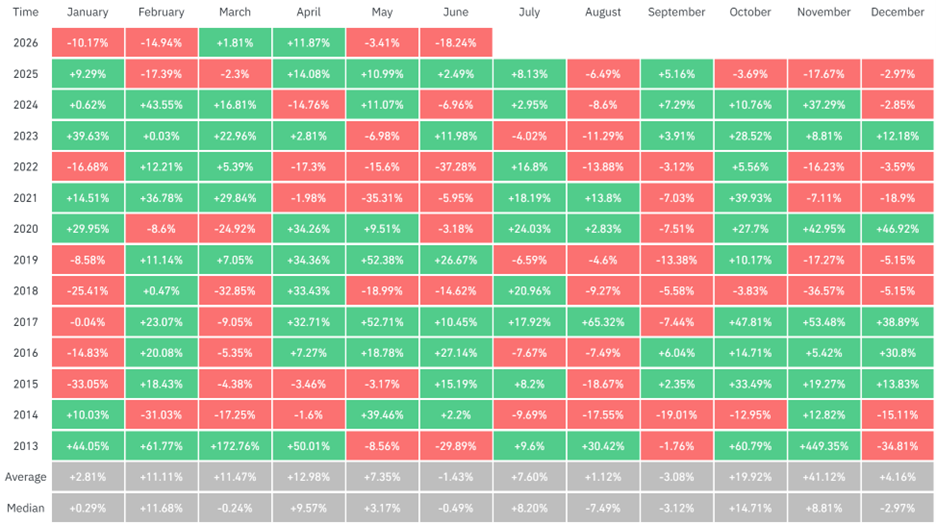
Our liquidity indicators can only show us through September. So for now, we can’t say when that low will hit. But if we look at the cycles history, we can see a pattern of significant lows appearing later in Q3.
Even with a longer wait, I don’t expect a future low to sink far beyond the $60,000 level.
When two significant lows indicated by my model months apart share a support level — as happened on Feb. 5 and June 5 — that suggests prices are unlikely to fall significantly.
Still, I’ll be watching our liquidity indicators closely. And you’ll be the first to know if I see anything that’ll change my outlook.
Best,
Juan Villaverde
P.S. Liquidity indicators can help me fine-tune my expectations for Bitcoin’s medium-term moves. But when it comes to timing, I rely on my Crypto Timing Model.
It’s accurately called the long-term bottoms and tops for the past three cycles with shocking accuracy. And thanks to my latest updates, it can now find the cycles for individual altcoins, not just the broad market.
My Weiss Crypto Investors members even get specific “buy” and “sell” alerts based entirely on when my model notes a change in the cycles.
To learn how you can benefit from these signals as well, click here.
