After correcting for three months, Bitcoin (BTC, Tech/Adoption Grade “A-”) took a breather and broke above the psychologically important $40,000 level.
Not one to be left behind, Ethereum (ETH, Tech/Adoption Grade “A”) broke above its own key resistance at $3,000.
They are currently trading at $44,320 and $3,166, respectively.
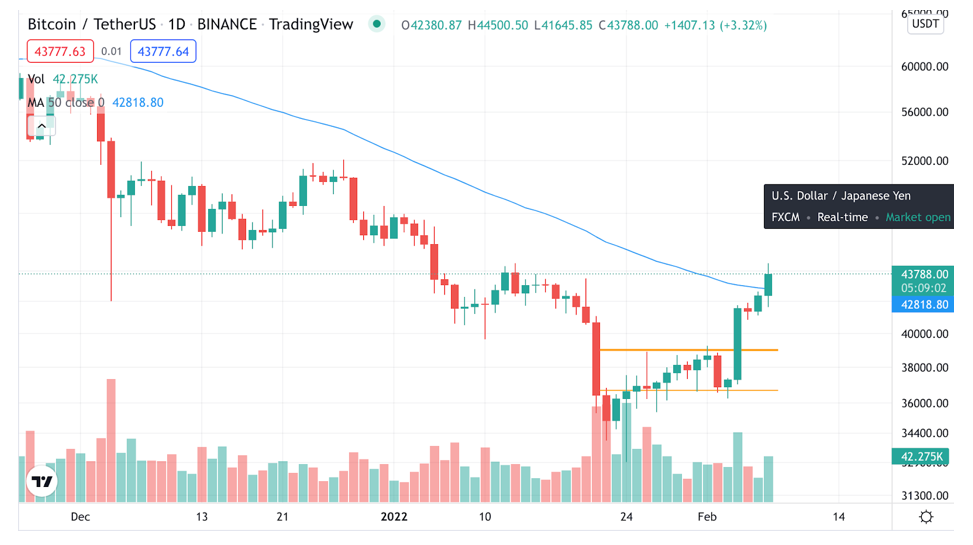
The BTC/USDT daily TradingView chart below shows that BTC broke above its 50-day moving average (50MA) near $42,818 and its Fibonacci retracement levels ($44,000) today.
A closing daily candle above these levels would confirm the breakout above $44,000.
The crypto market has been on the uptrend since Jan. 24. BTC increased 12.74% in the past seven days alone. This has helped sentiment to move away from bearish, with the Fear & Greed Index now in “neutral,” as opposed to “extreme fear,” as it has been recently. Funding rates have also been reset.
Helped by the recently halved inflation, which is now only 1.77% annually, we are also seeing illiquid Bitcoins growing two times faster than new coins mined! This means that long-term holding is growing much faster than inflation.
This bullish sign is the complete opposite of how it was during the beginning of the bear market in 2018, according to Glassnode data.
The ETH/USDT four-hour TradingView chart shows that ETH is trying to break a downward trend, as shown by the blue line.
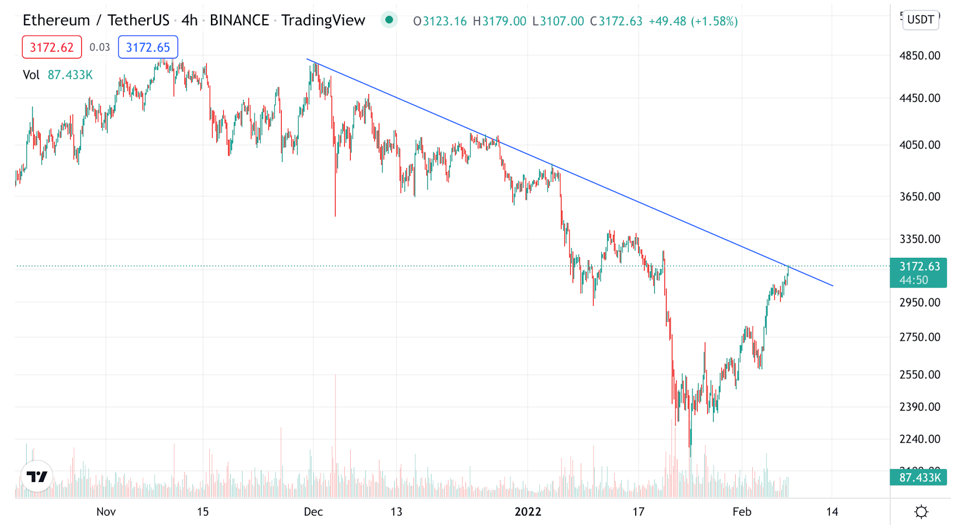
The price has been in this trendline since the top. Let’s see if we’ll break it this time!
Notable News, Commentary and Tweets
- KPMG in Canada adds Bitcoin and Ethereum to its corporate treasury.
- Sen. Ted Cruz (R-TX) discloses a Bitcoin purchase worth up to $50,000.
What’s Next
Bitcoin looks quite bullish, with indicators nicely lining up, and there are a few ways things can play out from here according to the technical analysis.
Two are bullish scenarios:
1. BTC is rejected from the $44,000–$46,000 area and retreats to retest support near $38,700–$39,700 before making the next push to $51,000.
Traders who are bullish are hoping for this scenario to catch an entry at around $39,700, where the yearlyvolume-weighted average price (VWAP)lies, as well.
2. BTC continues on its current trajectory without significant correction and reaches $51,000 as the first significant target. So, $46,000 and $49,000 are last remaining resistances before this level.
Of course, there are few bearish scenarios at this point, as well, but they would involve retesting that Jan. 24 low. I wouldn’t expect that at this point. In fact, I wouldn’t expect that until at least March, with its potential interest rate raise.
So, we’ll need to see if the wider macro picture can be kept at bay until then. It seems like it can be, as Bitcoin’s bullish push higher comes as equities remain quite weak. That’s a promising sign of a potential decoupling!
But no matter which way the market moves, we’ll be here, keeping you in the know.
Best,
Marija Matić