Bitcoin’s Forecast Beyond the Fed’s Latest Cut
 |
| By Juan Villaverde |
I’m often fascinated — and a trifle amused — by how much hope gets pinned on whether the Federal Reserve moves interest rates up, down, or sideways.
Legions of traders, investors and speculators sit glued to their screens, trying to decipher how a 25-basis-point cut might shape the future of risk assets.
Of course, the Fed’s policy choices matter. Not just in the U.S., but around the world. But what most people don’t realize is that the Fed does not set rates in a vacuum.
It simply follows the Treasury market — whether it admits that or not.
Fed Funds Track 2-Year Treasury Note Yields
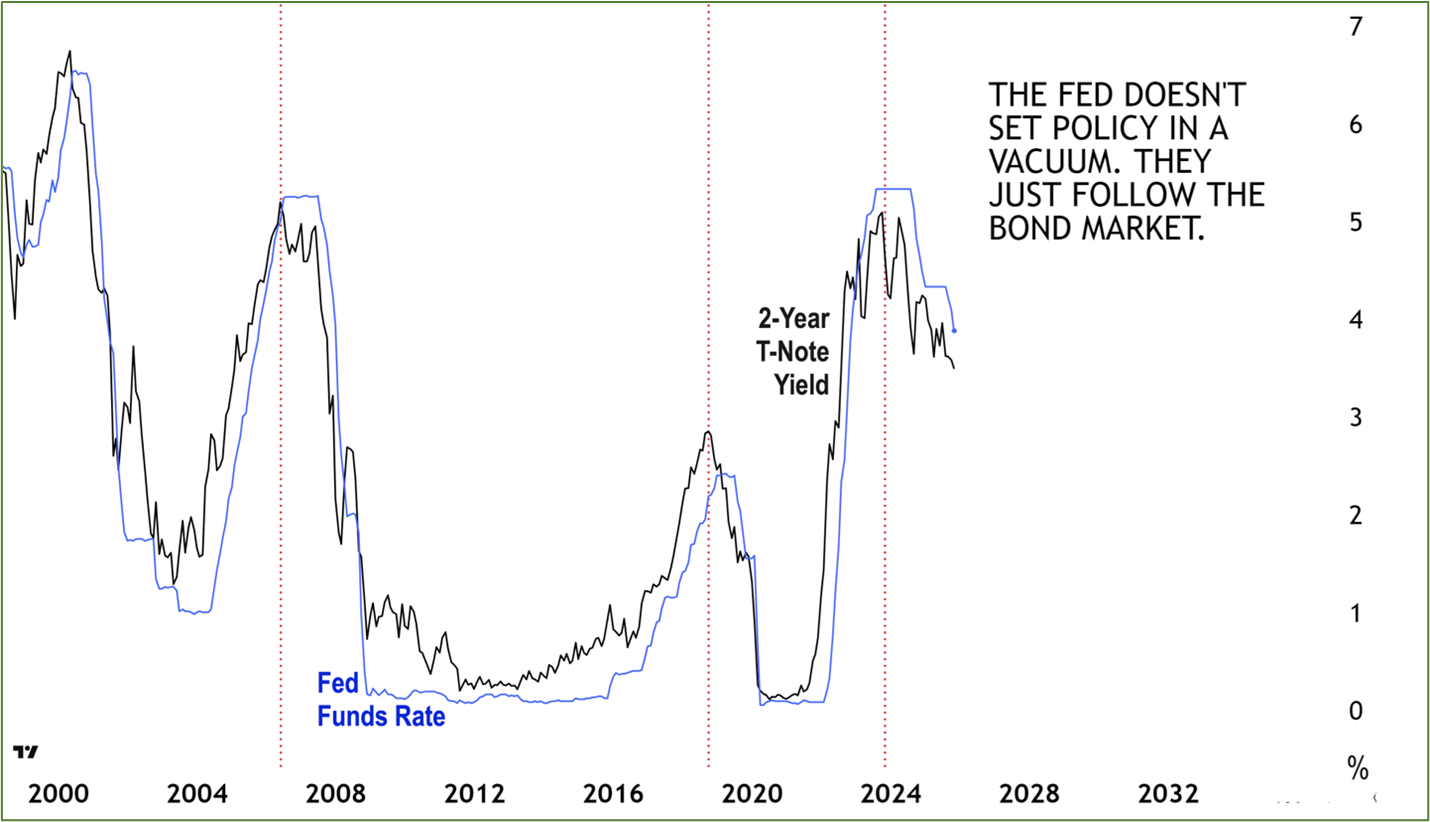
The red dotted vertical lines mark the last three times T-note yields began a major downtrend. The evidence is clear …
Every time the Fed starts cutting rates, yields have already turned down months earlier.
- T-Note yields started going down in November 2023; the Fed followed nearly a year later — in September 2024.
- T-Note yields started going down in November 2018; the Fed followed in August 2019.
- T-Note yields fell steeply in July 2006; the Fed followed in August 2007 — as the events hurtled toward the Global Financial Crisis.
This pattern holds all the way back to the late 1980s. The bond market always leads; the Fed always follows.
Which brings us to the present.
The rate cut this week? It’s already baked in. Nothing surprising about it.
In fact, it kinda makes you wonder why we even need a Federal Reserve. If Treasurys lead the Fed by the nose, why do we need an “enlightened” FOMC committee … to announce what everyone in fixed income already knows?
But I digress.
What really matters here is this: My research shows the Treasury market not only leads the Fed by about a year.
It also leads Bitcoin (BTC, “B+”).
By influencing liquidity roughly 10 months in advance, the Treasury market previews what crypto is likely to do next.
What T-bonds Forecast for Bitcoin
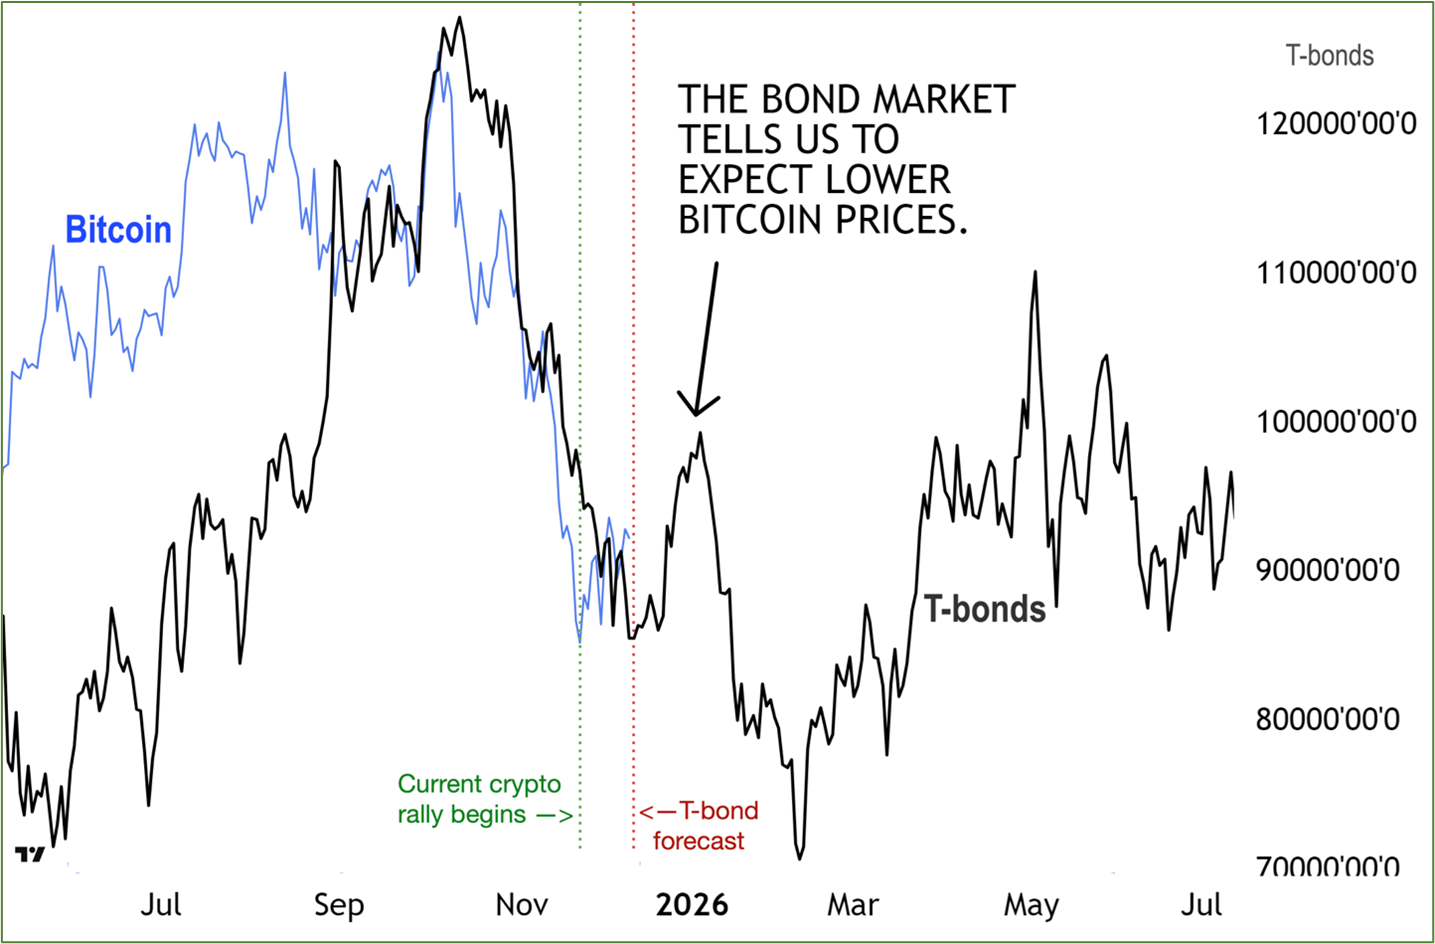
Notice even the small rally Bitcoin is experiencing now (onset marked by the green dotted vertical line) was anticipated by the bond market (red dotted vertical line).
But here’s the rub: T-bonds signal a decline into next year.
We also see that decline reflected in Central Bank Liquidity — the bridge between bonds and Bitcoin.
What CBL Portends for BTC
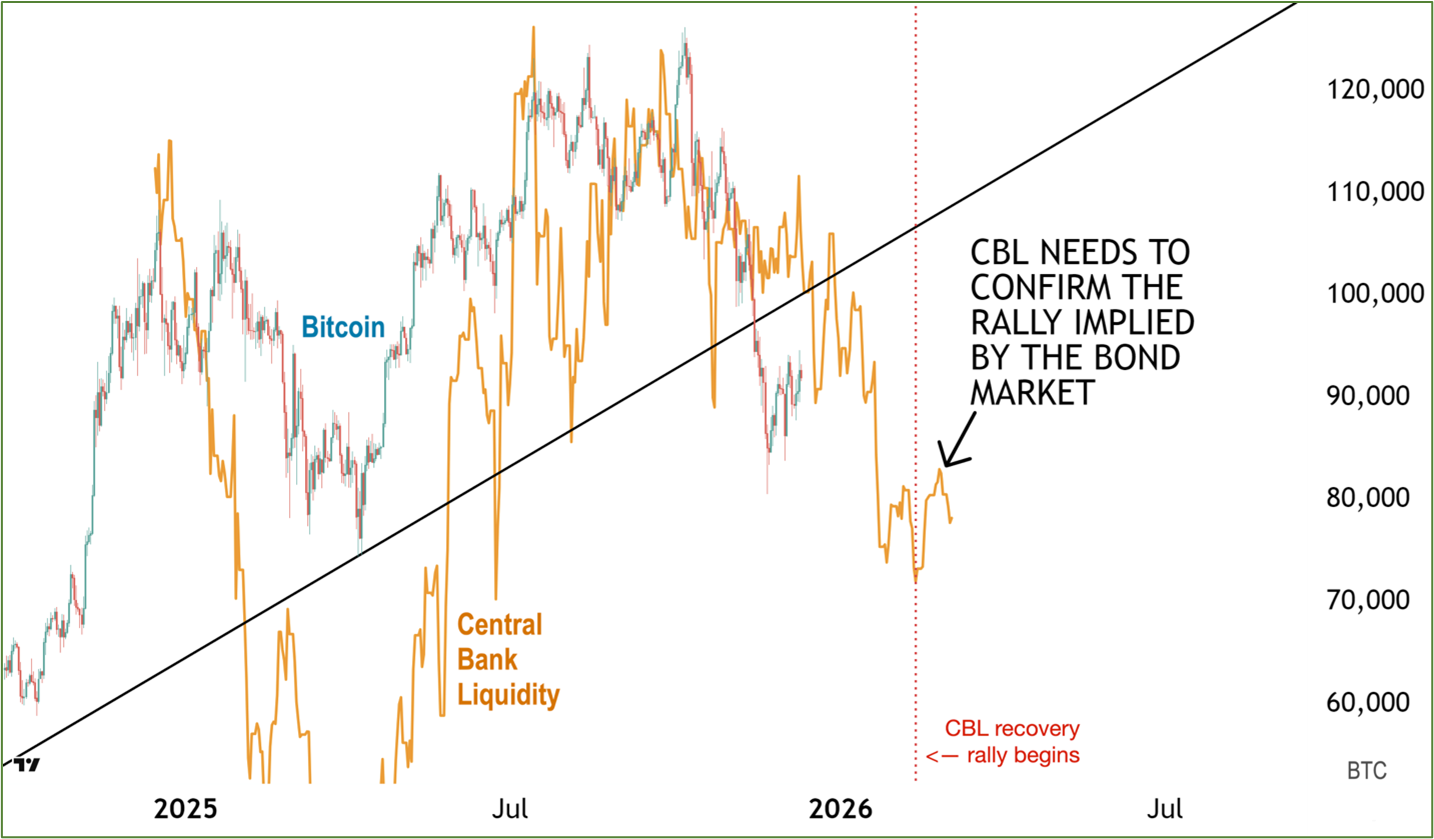
Happily, CBL finally appears to be inching higher after months of contraction. (The red dotted vertical line marks the start of this climb.) But this move so far is weak.
To be clear, I’m not totally dismissing the Fed’s relevance. Rate decisions do matter. But the Treasury market tells us what the Fed is going to do.
Moreover, interest rates affect Bitcoin with a long lag — roughly a year. So, whatever Powell announces this week … has almost no bearing on what crypto will do over the next few months.
The bond-Bitcoin link runs through Central Bank Liquidity (CBL). And until CBL does more than flatline, we cannot confidently say Bitcoin will see a strong rally early next year.
Even if bonds imply exactly that.
Odds are BTC will rally, which is why I use these tools. But no matter how you slice it, everything continues to point to a key crypto low forming early next year.
The precise timing depends on when CBL truly turns up. And on my Timing Model’s forecasts, of course.
Best,
Juan Villaverde
