Find the Market Top with Bitcoin’s Secret Early Indicator
 |
| By Juan Villaverde |
I’ve written several times about how global liquidity — the total stock of money and credit currently sloshing around the world — affects crypto asset prices.
Bitcoin (BTC, “A-”) — and by extension, other cryptos — mimic changes in global liquidity with about a 12-week lag.
That makes global liquidity a leading indicator for Bitcoin price action.
But there’s another leading indicator I’ve quietly been using since 2019. And it leads global liquidity by about 12 weeks.
Which means it leads Bitcoin’s price action by about 24 weeks.
That indicator is … the dollar price of gold.
Simply put, observing gold’s price action today can give us meaningful insight into where Bitcoin is likely headed six months from now.
I first noticed this correlation about six years ago. And it’s held up ever since …
What I Saw in 2019
In early 2019, I observed that gold made a significant cycle low in August 2018 and had been moving higher since.
I went back and reviewed past data. And I noticed a pattern: major lows in gold prices tended to precede major lows in Bitcoin.
Indeed, the correlation is hard to miss.
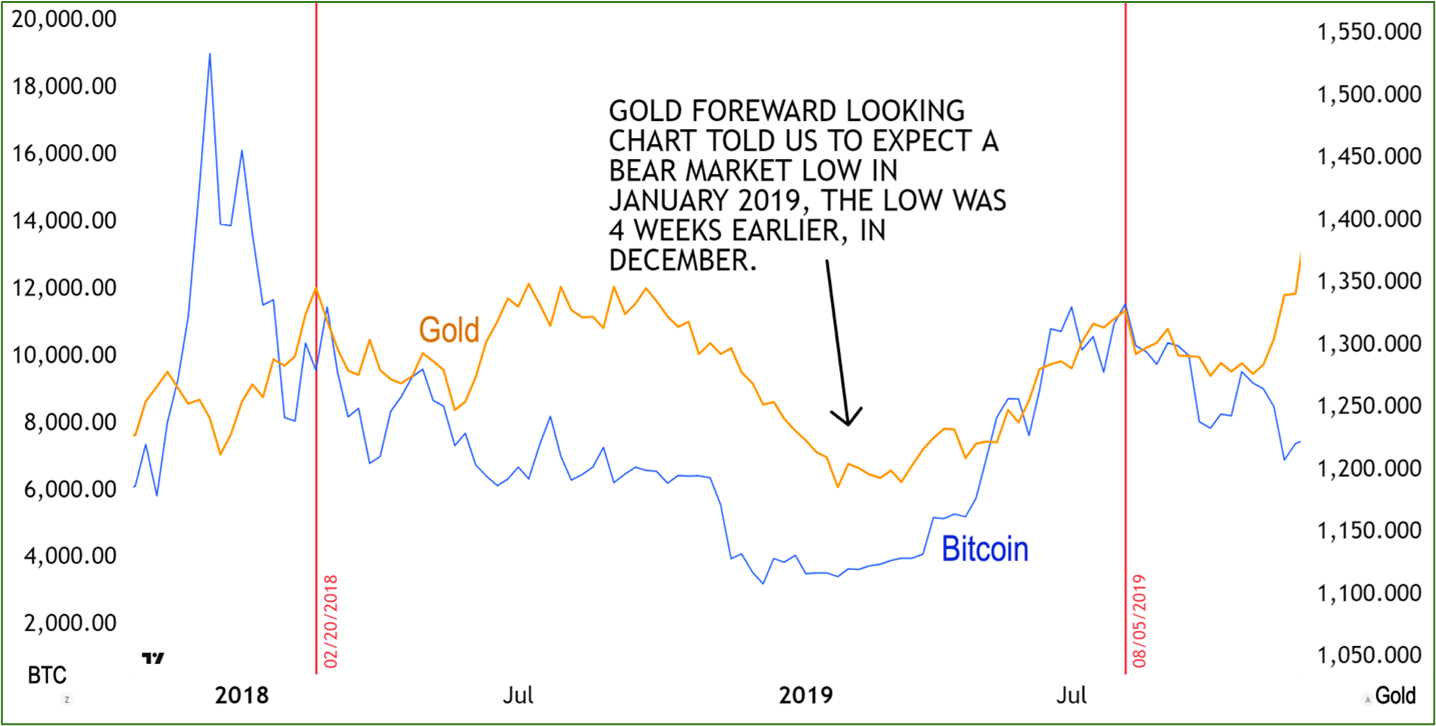
In the chart above, for example, the orange line tracks gold’s price action. I shifted it forward by 24 weeks to see how it lined up with Bitcoin’s.
You can see the orange line bottoms in January 2019, implying a Bitcoin low around that time. Bitcoin actually bottomed out slightly before that in mid-December 2018.
Note also the two red vertical lines on the chart.
The first one corresponds to a gold cycle top in September 2017. Shifted forward 24 weeks, it implied a Bitcoin top in February 2018.
Bitcoin’s actual high came in December 2017, though most altcoins topped out slightly later, in January 2018. Not a perfect correlation, admittedly. But still remarkably close.
More impressive, though, is the second red vertical line. This one pointed to a Bitcoin high by early August 2019, followed by a multi-week correction.
Sure enough, Bitcoin topped out (on a weekly basis) in early August. And then declined into December.
Again, the forward-shifted gold chart nailed it.
Moreover, I’m not the only one who noticed. Raoul Pal and Julien Bittel at Global Macro Investor also observed the same gold-Bitcoin correlation. They formalized it into a model:
Bitcoin and Gold 2021—2022
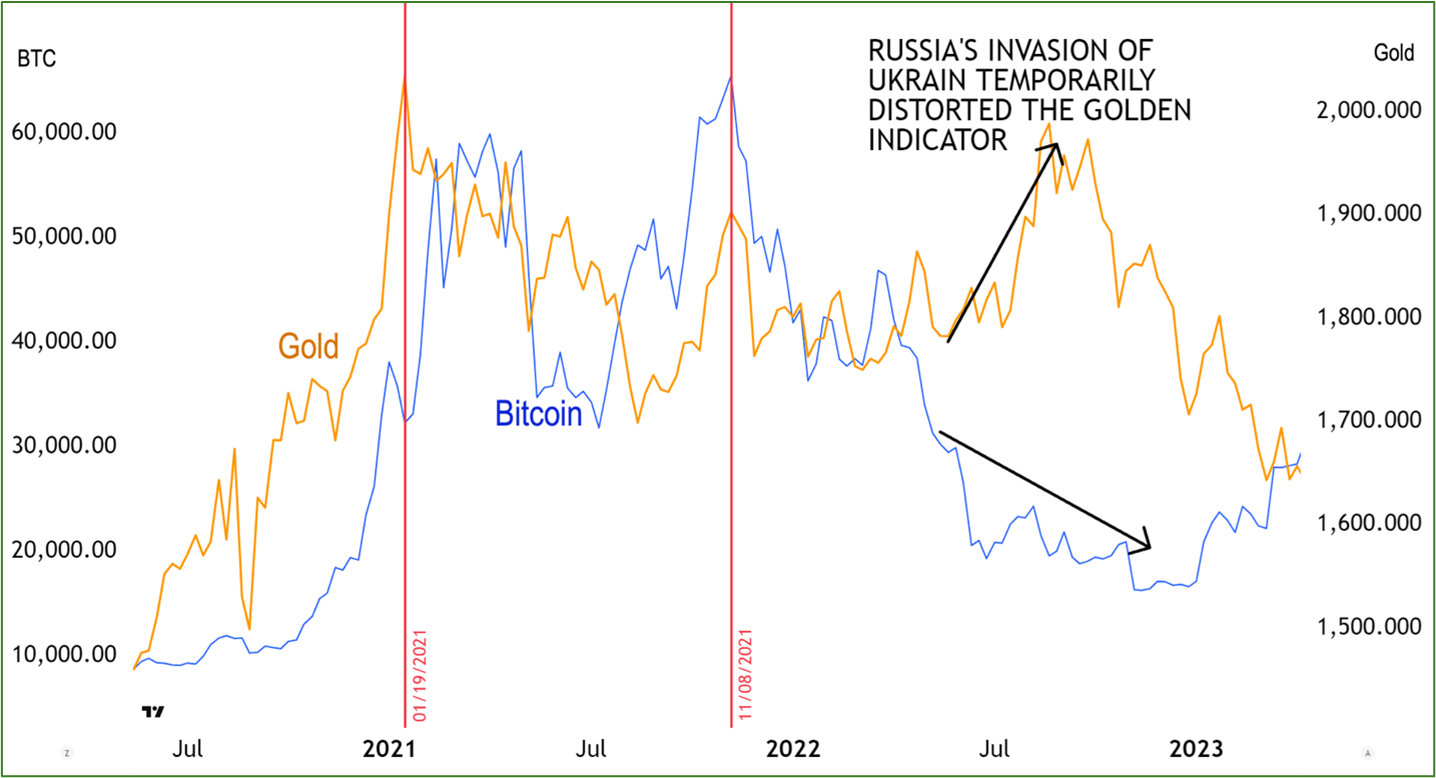
This chart said to expect a major Bitcoin top by late January 2021 (the first vertical red line). The actual high came a bit later, in early March 2021.
Even so, the correlation was still remarkable.
More importantly, the same chart showed a secondary high in November 2021 (the second vertical red line).
At the time, Bitcoin had broken out to new record highs, which had many people expecting the bull market to resume. But gold’s forward-shifted chart was painting a very different picture.
Instead of another rally, it pointed to a significant top and implied that the corrective phase was just beginning.
Interestingly, global liquidity was still going up at that point in time. But gold was flashing a clear warning: no higher highs ahead.
Indeed, apart from my Crypto Timing Model, I know of no other indicator that signaled a November 2021 top in crypto.
Now, to the elephant in the room: Russia’s invasion of Ukraine.
The impact of this macro shock caused the Bitcoin-gold relationship to invert.
The correlation remained. But instead of moving together, they moved in directly opposite directions. This is the only time I’ve seen a significant divergence.
What Gold Says Now
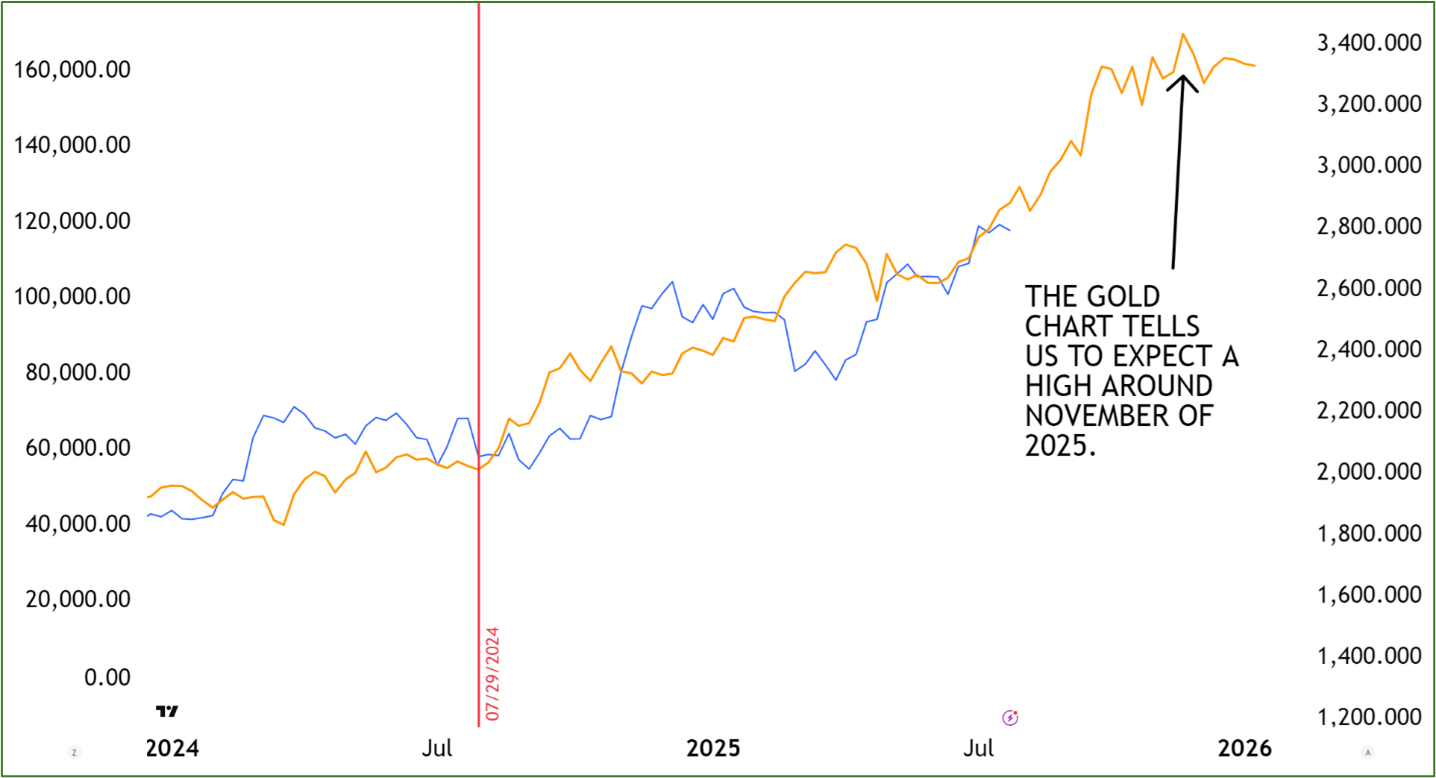
Take note of the week of July 29, 2024, marked by the red vertical line.
The gold chart told us Bitcoin would begin moving up following a period of sideways correction.
That’s exactly what happened: Bitcoin bottomed in early August 2024 after months of range-bound chop.
And now, it’s telling us to expect a significant high by late November 2025.
This corresponds to a significant high in gold made back in April. It also aligns perfectly with my Crypto Timing Model — which also calls for a major high around the same time.
Will this be the bull market top? I can’t say for certain.
But gold may hold the answer.
If gold rallies above its April high (near $3,450), that would be a strong signal that Bitcoin could march higher into 2026.
But what if gold rolls over and its chart breaks down?
That would be an early warning that crypto’s bull market may be nearing its end after November 2025.
And it just so happens … that’s when my Crypto Timing Model says to expect the cycle top.
Which means now is the time to ready your portfolio to ride the cycle higher.
Best,
Juan Villaverde
