 |
| By Marija Matic |
July was an eventful and strange month.
On one hand, we had an aggressive rate hike as well as an entry into the "technical recession" due to the second consecutive quarter of low GDP readings.
On the other, indices had the most bullish month since 2020. Crypto rallied even harder.
Investors were obviously betting that the bottom is in. But is it really in or is it just wishful thinking?
There are two main reasons investors believe it's the former.
First is because of the slightly less hawkish comments made by Federal Reserve Chair Jerome Powell following last week's Federal Open Market Committee meeting.
Indices were rallying hard in July because investors were betting the economic downturn would soon cause the Federal Reserve to end its aggressive hiking campaign to avoid a recession.
Basically, they believe the next rate hikes will be milder and more dovish and that Fed will continue printing money to stave off economic hardship.
Second, and in my opinion more importantly, arethe better-than-expected earnings reports released last week.
Of the S&P 500 companies who reported their earnings recently, 71% have beaten estimates, according to Market Watch. Stocks of the companies like Tesla (TSLA) and Philip Morris (PM) rallied hard due to their second-quarter results.
Since the tech sector was beaten up the most, investors jumped in Nasdaq stocks the hardest when the tables turned. Investors realized that the fears have been exaggerated, at least for now.
That's why the Nasdaq rallied around 12% in July, its most bullish month since 2020.
But that's nothing compared to the crypto market, which rallied that much in just a week!
It's the same old story — the most speculative assets dump the most during bear cycles ... and rally the most when market sentiment turns bullish.
Lots of investors are cautious, however. And with reason. This recovery has had the markings of a simple bear-market rally.
We'll need to wait to see if it can extend into something more.
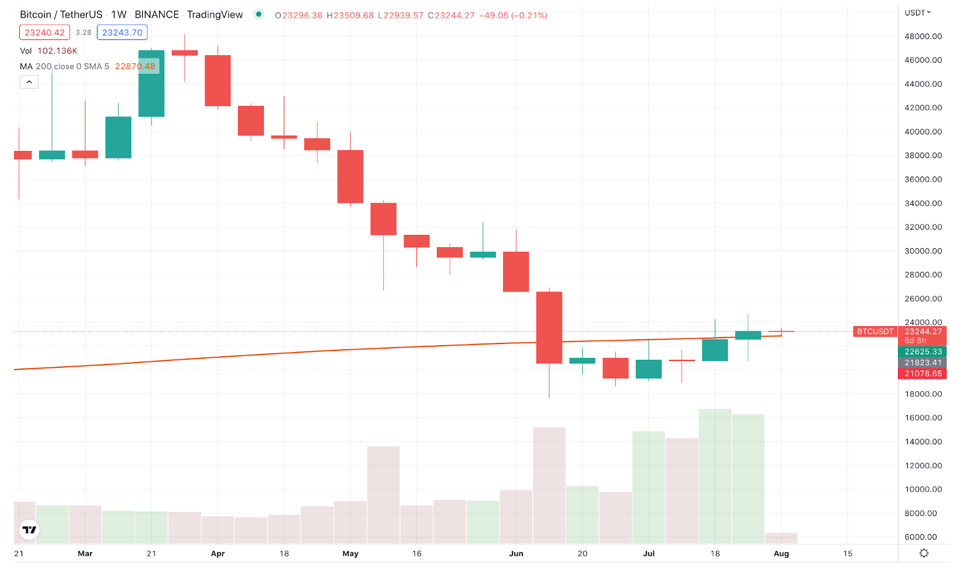
The BTC/USDT weekly TradingViewchart shows that Bitcoin (BTC, Tech/Adoption Grade "A-") has finally closed a week above its 200-day moving average (orange line):
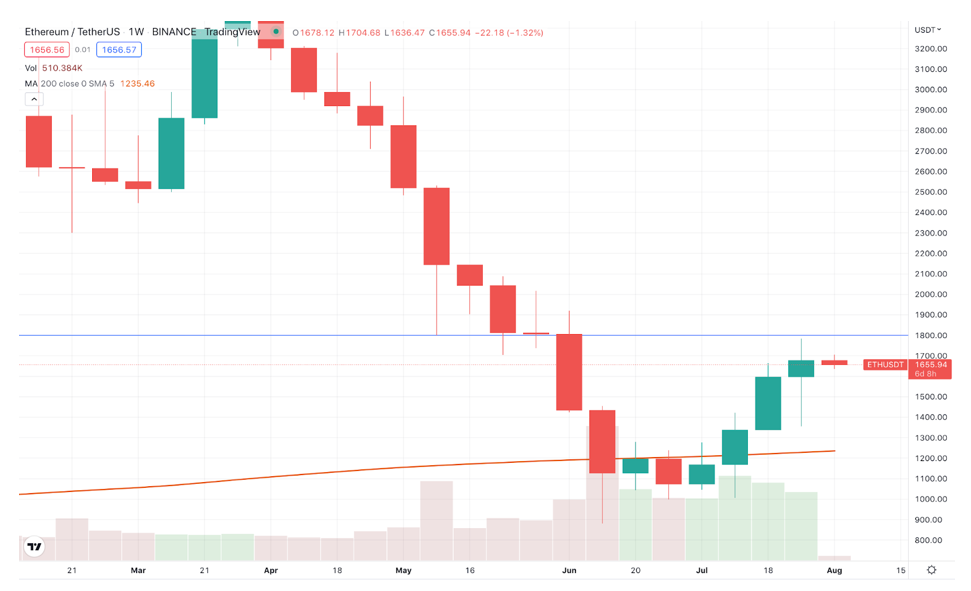
And the ETH/USDT weekly chart shows that Ethereum (ETH, Tech/Adoption Grade "A") led the market by closing above its 200-day moving average back in mid-July:
Notable News, Notes & Tweets
- Brazilian challenger bank Nubank has hit one million crypto users in the country barely a month after launching.
- Crypto reacts to the cash limit law that could "turn 10% of Israelis into criminals."
- Binance has lost 90% of users after implementing know-your-customer protocols, losing billions in revenue.
What's Next
After a bullish weekly and monthly close, BTC is correcting to cool off, and the broad market is following suit. Its weekly 200-day moving average around $22,860 is the first support zone we'll observe to determine how it'll behave going forward.
That's because, typically, the market follows Bitcoin. But the market leader's dominance has broken an important level, which means we could see a potential rally in altcoins, if the market permits.
All this analysis, however, may prove moot in the face of the delicate macro situation currently unfolding, with all eyes now on the flight of Sen. Nancy Pelosi (R-DA) as she travels to Taiwan.
Because a hot war in Ukraine wasn't enough geopolitical turmoil, we now have to rile up China.
In an attempt to lighten the situation, investors on Twitter joked this was a 3R investment — i.e., highly risky.
I can't say they're wrong. Let's hope it's a risk that pays out.
Best,
Marija Matić