The Best Chance to Buy Bitcoin Is Almost Here
 |
| By Juan Villaverde |
We are officially in a new year.
And the biggest question I’ve gotten about the crypto market in 2026 is …
“Will this year see the bull market continue? Or is ‘crypto winter’ already upon us?”
I understand the confusion.
I’ve been calling for a powerful Q1 rally for a while. But at the same time, I’ve also said that crypto’s 4-year cycle peaked Oct. 6.
Here’s the tricky part, though: Both can be true at the same time.
We can still expect a strong Q1 rally — even if the broader crypto bull is kaput. And indeed, according to the cycles, this is likely the case.
So, let’s unpack what exactly a 4-year cycle peak in late 2025 implies for early 2026.
Bitcoin’s Near-Term Outlook in a Nutshell
First and foremost, we should not expect Bitcoin (BTC, “B+”) to make new highs in 2026.
That means $125,000 is its likely ceiling this year.
That doesn’t mean a new high can’t happen. In fact, if liquidity continues to improve week after week, the probability increases.
But the cycles analysis tells us not to hang our hats on that outcome.
And in the immediate future, between now and late January/early February, we are more likely to see new lows.
In fact, Feb. 12 shows up on my model as a particular date of interest.
That, combined with the fact that Bitcoin has struggled to piece together any meaningful advance since its last 80-day cycle low on Nov. 21, means we’ll likely continue to slide downward into that low.
Meaning, now that the holidays are over and traders are back to their screens, downside pressure on BTC is likely to resume.
Don’t panic if you see that play out.
Because that early Q1 low I mentioned will likely be significant, according to my indicators. I think it’ll turn out to be a 320-day-cycle low.
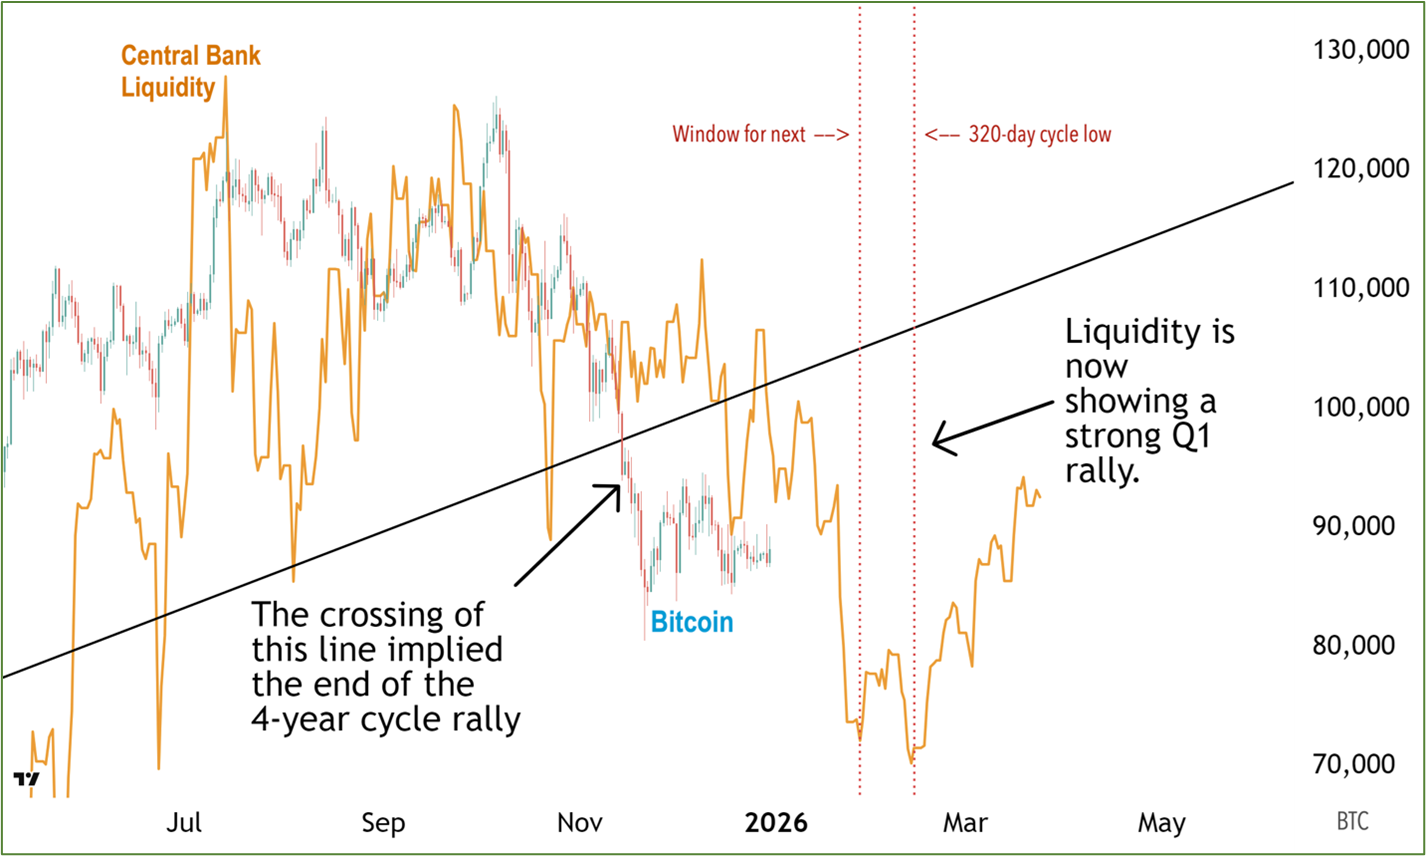
Take a look at Central Bank Liquidity (CBL) above, and you can see what I mean.
It moves markedly lower between now and the window for crypto’s next 320-day-cycle bottom (marked by the pair of red dotted vertical lines).
Which is roughly a month away.
In plain English, this means I expect additional sell pressure to push Bitcoin down for about the next month. Then, we should find strong, long-term support.
How far do I see BTC falling?
As I explained before, cycles like repetition. And with a weaker rally during peak bull season, I expect this correction to be mild.
At least, mild in terms of crypto’s wild swings.
If you see BTC trade back into the $70,000s, don’t let it ruin your day. That’s about a 44% drop from its cycle peak, which is a conservative long-term correction for the OG crypto.
Why I Say the 4-year Cycle Has Already Peaked
Once a long-term bottom has formed, I believe we will see a meaningful rally in Q1. But, as I said, that rally likely won’t take us to new highs.
Here’s why …
Observe the black uptrend line. It connects Bitcoin’s last two 320-day cycle bottoms.
In the past, Bitcoin crossing below this line has always signaled the start of Bitcoin’s 4-year cycle decline. Without exception.
This comes directly from my Crypto Timing Model. And it says the up-phase of crypto’s last 4-year cycle is effectively over.
This is why, despite any intervening rallies, I do not expect Bitcoin to make new highs in 2026.
Believe it or not, I made almost the exact same call on Solana roughly 10 months ago.
What Happened to SOL in February 2025
In fact, what happened with Solana is an excellent analog for what to expect from Bitcoin — and the rest of crypto — in 2026.
So, let’s dig into it.
While Bitcoin’s cycle dominates the broad market’s trend, individual coins follow their own cycles, as well.
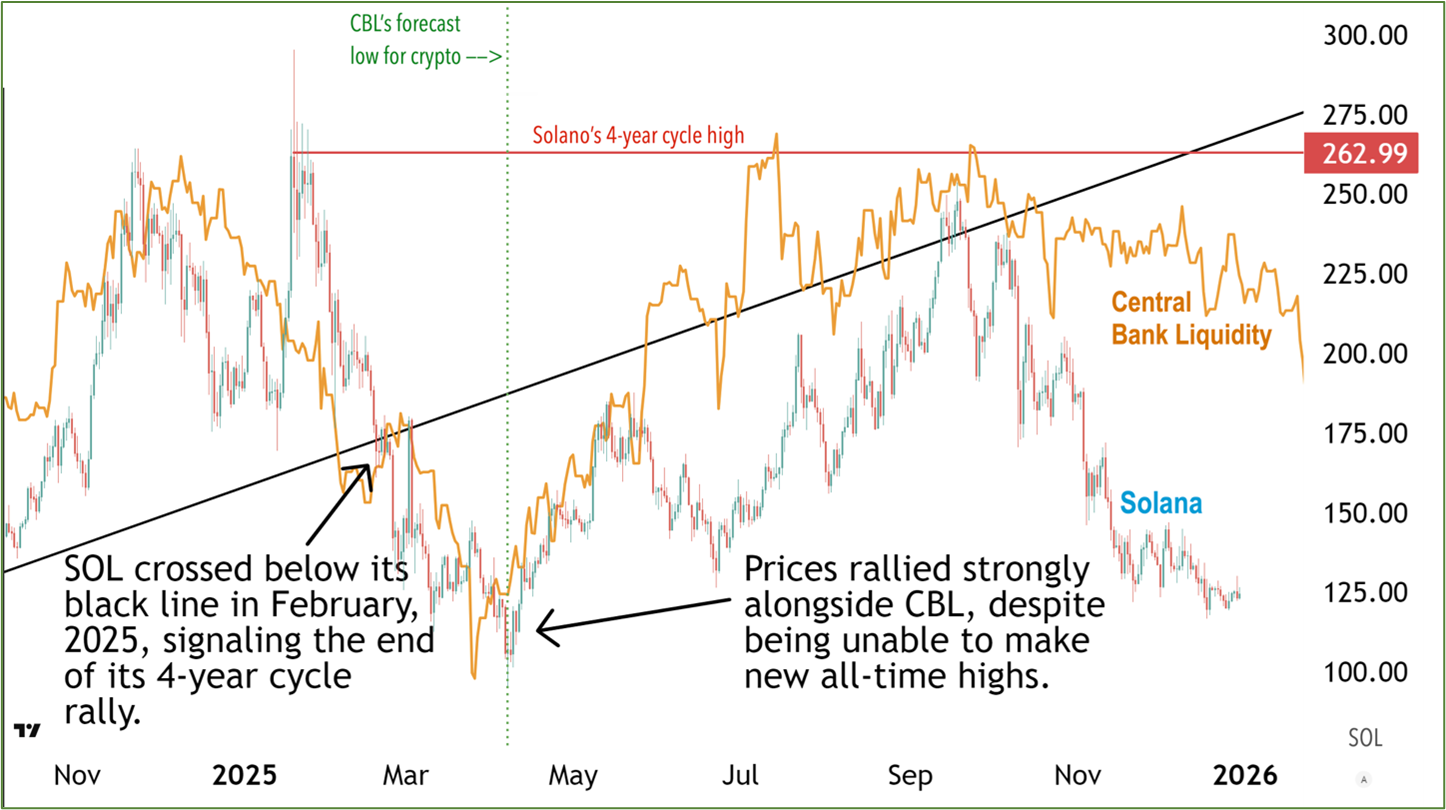
And last year, SOL’s deviated from BTC’s big time. It broke below its black uptrend line on Feb. 18. That told my Crypto Timing Model its 4-year cycle peak occurred Jan. 18.
That meant that even if Solana rallied after that date within the larger bull market, it would not again climb above its Jan. 18 high.
And that’s precisely what occurred.
The green vertical dotted line marks the date CBL forecasts a crypto market bottom — late March. The actual low? April 7.
In the months that followed, Solana rallied from about $100 to roughly $250 by Sept. 18 — a respectable 150% move. And certainly a tradable rally for anyone aware of the big picture.
But it was notably not enough for SOL to break above resistance, marked above by the red horizontal line.
How is this like Bitcoin’s setup in early 2026?
Answer: In almost every way.
Just as with Solana, my Crypto Timing Model says Bitcoin’s 4-year cycle top is behind us (since Oct. 6). But simultaneously, global liquidity — as measured by CBL — points to a major low between late January and early February.
Can both be true? Absolutely!
For long-term investors, this is the entry opportunity you wait for all cycle: The chance to get in at multi-year lows.
Which is exactly what I help my Weiss Crypto Investor Members do. Not just for Bitcoin, but for all the top, blue-chip cryptos.
Like I said, altcoins have their own cycles. They follow Bitcoin’s general trend but can see big differences in timing.
But with my Crypto Timing Model 2.0, we can target individual cycles to know the best time to jump in … or out … of our positions.
To learn more about how Version 2.0 works and how it can help you make the most of this pivotal moment in the long-term cycle, click here.
And for traders, your first chance to grab gains from crypto in 2026 isn’t far away.
That said, you’ll still be trading a rally in a tough market. So, you’ll want to be strategic and realistic about your approach to minimize risk and maximize reward.
Best,
Juan Villaverde
