 |
| By Juan Villaverde |
Bitcoin (BTC, “A-”) kicked off the year with a bang.
But, as I expected, that rally didn’t last. Crypto continues its downtrend that started in Q4 2025.
But it wasn’t supposed to be this way.
At least, not according to the cycles. Within the context of the large 4-year cycle, 2025 should have given us more than we got.
Here’s the thing: We already know why 2025 has been unusually weak …
Global liquidity — the amount of money and credit created by central banks — has been flat all year.
Fortunately, I have every reason to believe that will change in 2026.
Because January looks set to usher in a new era for crypto on that front, too.
Bitcoin Weakened by Tepid Liquidity
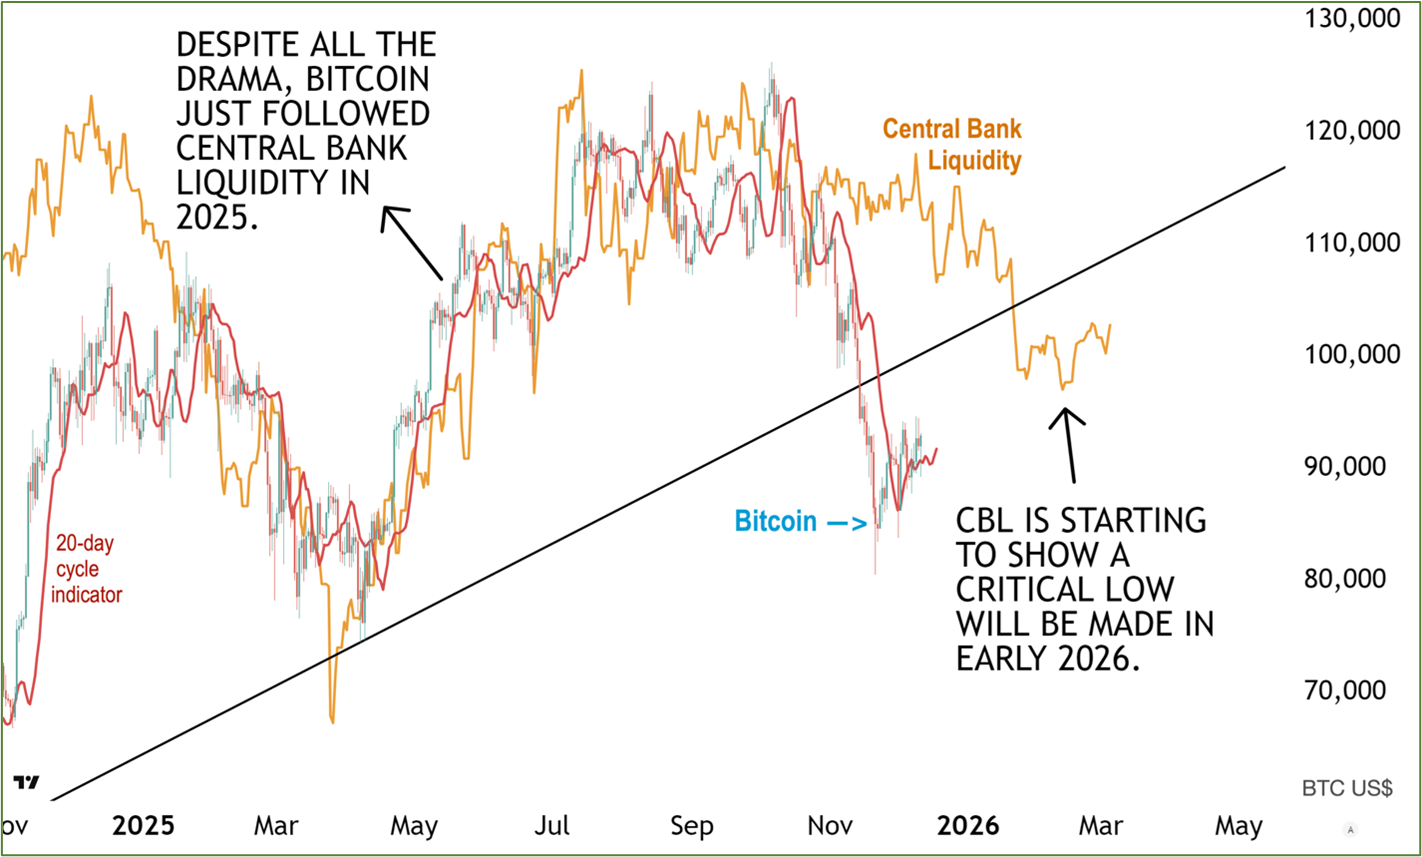
Both Bitcoin and the altcoins have been stuck in the mud throughout 2025. Because liquidity has been stuck in the mud.
In fact, almost all crypto follows CBL almost religiously … after about a three-month lag. Whatever CBL does today will be reflected in crypto asset prices roughly three months from now.
And that has been the case as far back as crypto data goes. Occasionally, however, a few altcoins buck the trend.
In fact, my Weiss Crypto Investor Members were able to bag a nice 56% gain on one such altcoin.
(To learn how we were able to find this opportunity and what coins we have in our sights next, click here.)
Exceptions aside, the fact remains: Crypto assets have a hard time rising consistently when liquidity conditions are depressed. And they were extremely depressed throughout the second half of 2025.
But here’s some good news: Liquidity is expected to rise in early 2026.
Considerably.
T-Bonds Flag Crypto’s Next Big Buying Opportunity
Below is a chart tracking Bitcoin, Central Bank Liquidity and the 20-year Treasury notes.
Note how all three move roughly in unison. Especially in the second half of 2026, all are quite tightly aligned.
Bonds lead CBL by about 10 months, and CBL leads Bitcoin by about three months.
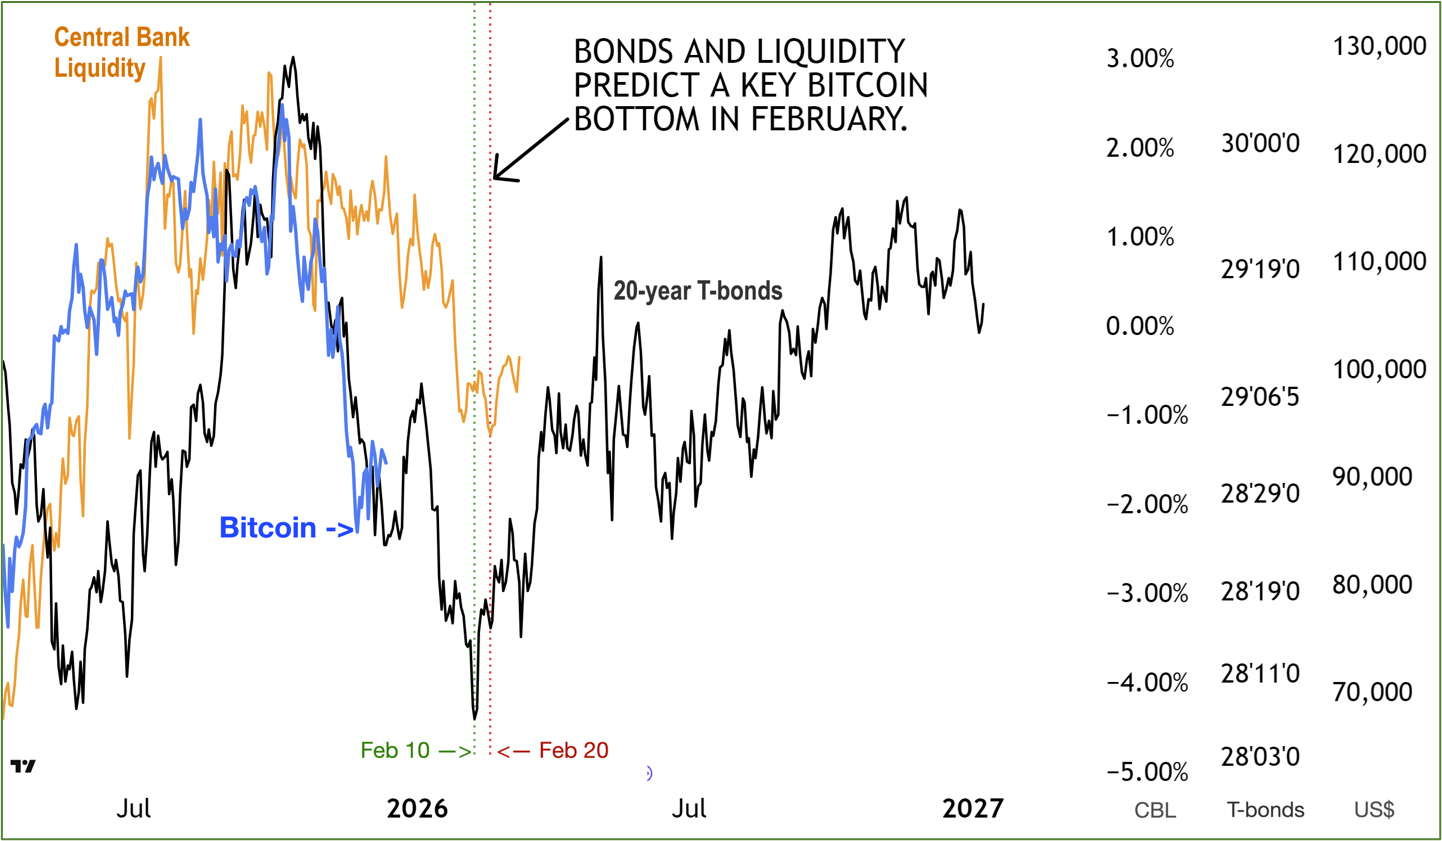
Put another way: Treasurys lead Bitcoin by roughly 13 months.
Now, observe the vertical dotted lines. Both bonds and liquidity point to a critical bottom in Bitcoin — and altcoins — between Feb. 10 and Feb. 20.
And according to T-bonds, which gives us a preview of the entire year, this may well be the low of 2026.
In other words: We are within the window of error for the best buying opportunity for crypto over the next year.
Of course, this assumes the “bonds lead liquidity which leads crypto” correlation will continue to hold up.
And I think it will, thanks to these three key conditions:
-
Federal Reserve rate cuts. More rate cuts are good news. Because when rates come down, bond prices rise. And when bond prices rise, liquidity tends to go up about a year later.
So, the bond market is telling us to expect easier liquidity conditions in 2026. And the Fed cutting rates in December 2025 — and likely again next year — suggests bonds will continue to rally. Thus, implying higher liquidity throughout 2026 and into 2027.
-
The end of the Fed’s quantitative tightening (QT). This is not liquidity-positive per se. But it means the Fed officials will no longer be actively draining dollar liquidity out of the financial system week after week. Which they’ve been doing since 2023.
Ending QT removes a major headwind for crypto.
-
The Treasury General Account (TGA) is finally turning. Here’s the main culprit behind why crypto returns were so abysmal in the second half of 2025:
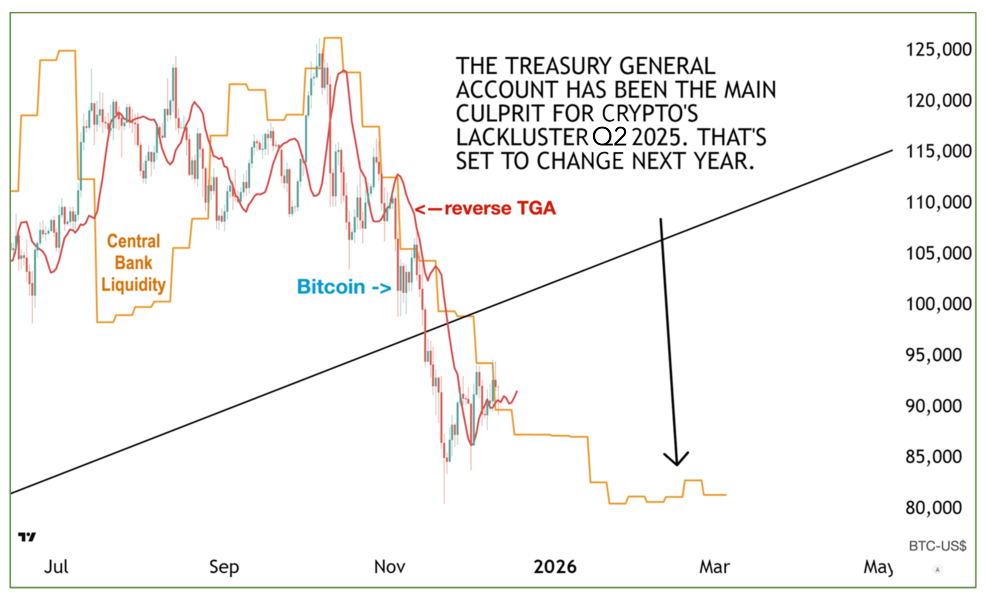
When the reverse TGA goes up, liquidity improves. When it goes down, liquidity deteriorates.
Like CBL, TGA leads Bitcoin by about three months. The good news is that after months of draining liquidity, the Treasury is finally done.
Liquidity is starting to rise again.
Account for the three-month lead time, and the TGA points to a Bitcoin bottom between late January and late February.
This lines up with both CBL and the bond market. And with what my Crypto Timing Model says, as well.
So, while 2025 may have been disappointing, 2026 is shaping up to be very different.
And with Bitcoin’s correction likely to end soon, this is your chance to get your portfolio ready.
To see how I plan to do just that for my long-term buy-and-hold strategy, click here.
Best,
Juan Villaverde
