
 |
| By Juan Villaverde |
While TradFi traders stayed away from their desks over the holiday weekend, Bitcoin (BTC, “B+”) showed signs of strength.
Since retesting $60,000 — and briefly trading slightly below — Bitcoin has been trading mostly sideways. It rallied to hit roughly $63,000 over the weekend.
And after a brief pullback this morning, it’s back up to about $63,400 as I write.
Here’s where things get exciting: BTC is behaving exactly as we suspected it would according to its forward-looking liquidity indicators, particularly Japanese M2.
JpM2 is almost completely flat between now and late July. And Bitcoin could be described as doing pretty much exactly the same throughout this time period.
And, as I've been saying for weeks, this is entirely within what the liquidity outlook for this period suggested all along: Falling prices starting in early May—that's when we liquidated the bulk of our positions—with a low reached in early June and a retest in late June.
We're in that retest phase right now.
But before we get ahead of ourselves and search for the next big rally, we first have to identify the long-term cycle low.
I am, first and foremost, a cycles analyst. And that approach is critical to help me determine whether signs of strength indicate a near-term bounce, or a more substantial move higher.
As I’ve said before, my Crypto Timing Model and JpM2 both see a significant low ahead on July 22. And I’ve said that this will act as a double bottom for the June 5 low.
Here’s what that means for BTC in the near term: More sideways price action, with a rally sometime in late July.
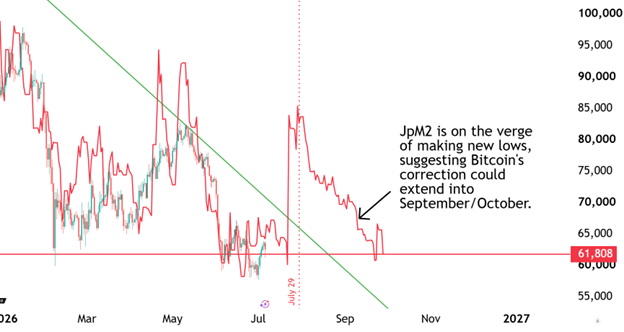
As you can see, Bitcoin fell back to the $60,000 level and then rallied up to $63,000 over the weekend.
There have been several attempts to push prices below $60,000, yet none have been sustained so far. According to JpM2 — the red line — Bitcoin should stabilize around these levels and stage a rally within the next few weeks.
Now, observe the area to the right of the dotted red vertical line: This is JpM2's next forecast for a Bitcoin top, on or around July 29.
That means the rally we expect will be short-lived — just a few days into the final stretch of July.
That’s big. It’s our first sign that perhaps, July may not be the 4-year cycle low.
Until recently, JpM2 was showing a prominent low in July. My own Forecasting Model shows a significant low in July as well. Enough that it was reasonable to look for evidence that July could give us the 4-year-cycle low.
But now, evidence to the contrary is beginning to stack. Take a look at JpM2 as it projects into September, and you’ll see it’s falling.
That tells me that Bitcoin's 4-year cycle pattern could repeat almost verbatim in 2026.
What do I mean by this? It's widely known that Bitcoin's 4-year cycles tend to run almost exactly four years, with bear markets lasting about 12 months.
Thus far, this pattern has repeated like clockwork.
This 4-year cycle started in November 2022. Four years later takes us to November 2026 as the window to look for the bottom.
Even if we scale down to the 320-day cycle, which lasts almost about a year, we see a similar set up. The current 320-day cycle — the bear market year — started in October 2025.
Twelve months later takes us to early October 2026.
So, October or November is where we'd expect the bear market to hit bottom, if this pattern holds.
To that point, my Forecasting Model has also consistently pointed to a protracted consolidation period through the remainder of 2026. That suggested prices won't pick up materially even after a 4-year-cycle low is established.
Now, JpM2 seems to agree.
This indicator has continued to fall and is now on the verge of making fresh new lows — as shown by the solid red horizontal line marks its current level. In fact, it's uncomfortably close to breaking down into new lows.
To be clear, JpM2 hitting a new low does not mean that BTC’s price will do the same. All it suggests is that Bitcoin cannot rally while it falls — as we would expect once the bear market is over.
Whether BTC’s price falls in step with JpM2 or merely continues to cruise sideways depends heavily on how strong the incoming July rally turns out to be.
Here’s what this all means …
Liquidity falling almost non-stop between late July and late September is a sign that despite prices likely bottoming in July, Bitcoin will likely remain in consolidation mode for a while after.
At least through late September.
Bottom Line for Investors
The hunt for the long-term lows is on.
Confirmation that we’ve crossed both the 320-day low and the 4-year-cycle low would relieve a lot of fear, uncertainty and doubt over Bitcoin potentially crossing below support at $58,000.
It would also give long-term investors the chance to load up without too much worry.
That’s exactly why my Crypto Timing Model is constantly monitoring not just Bitcoin’s cycle, but that of select altcoins as well. The moment these lows are confirmed, it’ll alert me right away.
And that’ll be my signal to act and load up on specific blue-chip cryptos I believe will do well in the coming cycle.
To learn how your long-term crypto strategy can benefit from my model’s signals, click here.
Best,
Juan