 |
| By Juan Villaverde |
Last week, I warned that the economic impact of ongoing hostilities would eventually show up in the bond markets.
And now, they have.
As I write, global bond markets are selling off sharply, driving interest rates to levels not seen in years — or in London, decades. Inflation is again on the march, and well above expectations.
The investment markets fear another period of stagflation: Low growth paired with high inflation.
Bond markets, then, have become another excellent proxy for how the world is pricing in the economic impact of protracted Strait of Hormuz closure. That makes it relevant to what my Forecasting Model is predicting for oil and bonds. And how they relate to the price of crypto.
Last week, I showed how my model predicts interest rates rising through August–September of this year. That move is well underway.
Oil is another piece of the puzzle …
Oil’s 240-Day Cycle
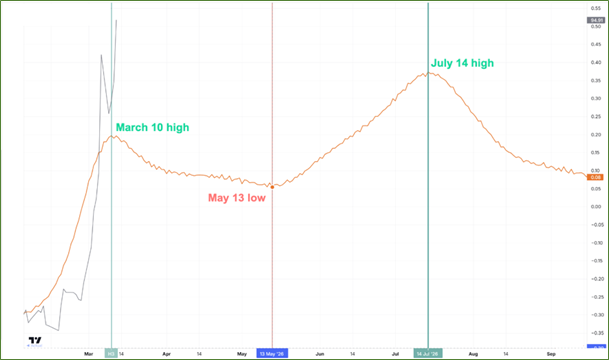
The remarkable thing is how then inflection points above line up almost perfectly with the forecasts for crypto and bonds.
For example, the May 13 date (for the trough in oil prices) also shows up on Bitcoin's model and on both Central Bank Liquidity (CBL) and Japanese M2 (JpM2) money supply indicators.
For oil, the mid-May date marks a low and the start of a new leg higher in prices.
That tracks: Bitcoin (BTC, “A-”) tends to trade in negative correlation to oil when oil is surging. It tracks well with bonds too, as interest rates tend to rise — bond prices fall — when oil rallies.
So, according to my model:
- Interest rates are set to rise through August.
- Oil is set to rise through mid-July.
- And this should cause Bitcoin to fall through mid-July as well.
Adding further credibility to this is the fact that the negative correlation between oil, stocks and crypto has returned in full force as of last Thursday:
Bitcoin, Oil and U.S. Stocks
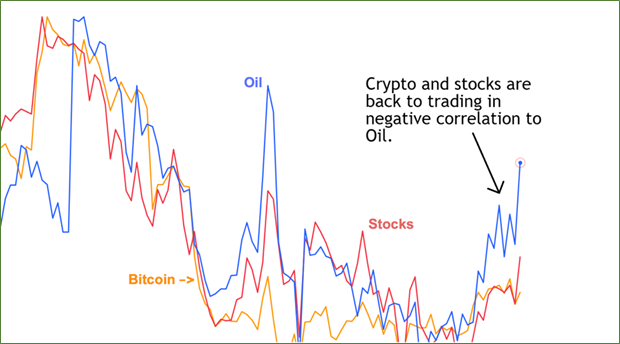
You've seen this chart before: oil, stocks and Bitcoin. All heading down together since last Thursday.
After months of largely ignoring the prolonged Strait of Hormuz closure, markets are starting to pay attention again.
It seems another round of the Middle East conflict is starting right on schedule. And this could be the final act. Because my model is anticipating a major trend change around July. Which could well coincide with a more permanent resolution of this quagmire.
In the meantime, brace for lower prices … and keep an eye out for your chance to load up.
This correction is going to bring the best buying opportunity for the rest of the year.
To see when exactly my Crypto Timing Model says to act, and which coins to target, click here.
Best,
Juan Villaverde
