The Numbers Don’t Lie: Bitcoin’s 4-Year Low Is In!

 |
| By Juan Villaverde |
There’s one question I’ve gotten multiple times over the past few days …
Do we actually have a floor for Bitcoin (BTC, “B+”)?
I understand the skepticism. Nobody wants to get caught flat-footed, calling a bottom too early.
That’s why I want to walk through the math with you. Because once you actually run the numbers, the case for "the low isn't in yet" gets very hard to make.
Let's start with the size of the recent move …
This is the biggest Bitcoin rally since early November 2024. That’s right — to find a comparable surge, you have to go all the way back to the last U.S. election cycle!
With the midterms in our imminent future, that says something.
Think about what it took to produce that kind of move back then. Trump won, and the market greeted him as a crypto-friendly president. He promised sweeping pro-crypto regulation. And his administration delivered the GENIUS Act, with the CLARITY Act pending.
Shifting America’s entire regulatory posture toward crypto was a powerful, undeniably external catalyst. And markets reacted accordingly.
Now compare that to the author of the current surge: The U.S. Treasury increased its buyback operations from $2 billion to $4 billion.
That’s far from meaningful liquidity in the grand scheme of things. Alongside America’s burgeoning national debt — which just hit $40 trillion — it amounts to a barely visible 0.01%.
And yet, such modest news was still somehow sufficient to fuel Bitcoin's strongest move up in nearly two years. This matters enormously. Because of what it reveals about the underlying strength of this market.
Let’s take a closer look at what happened after the November 2024 election move. I think you’ll find it instructive …
Bitcoin’s 2024 Election Rally
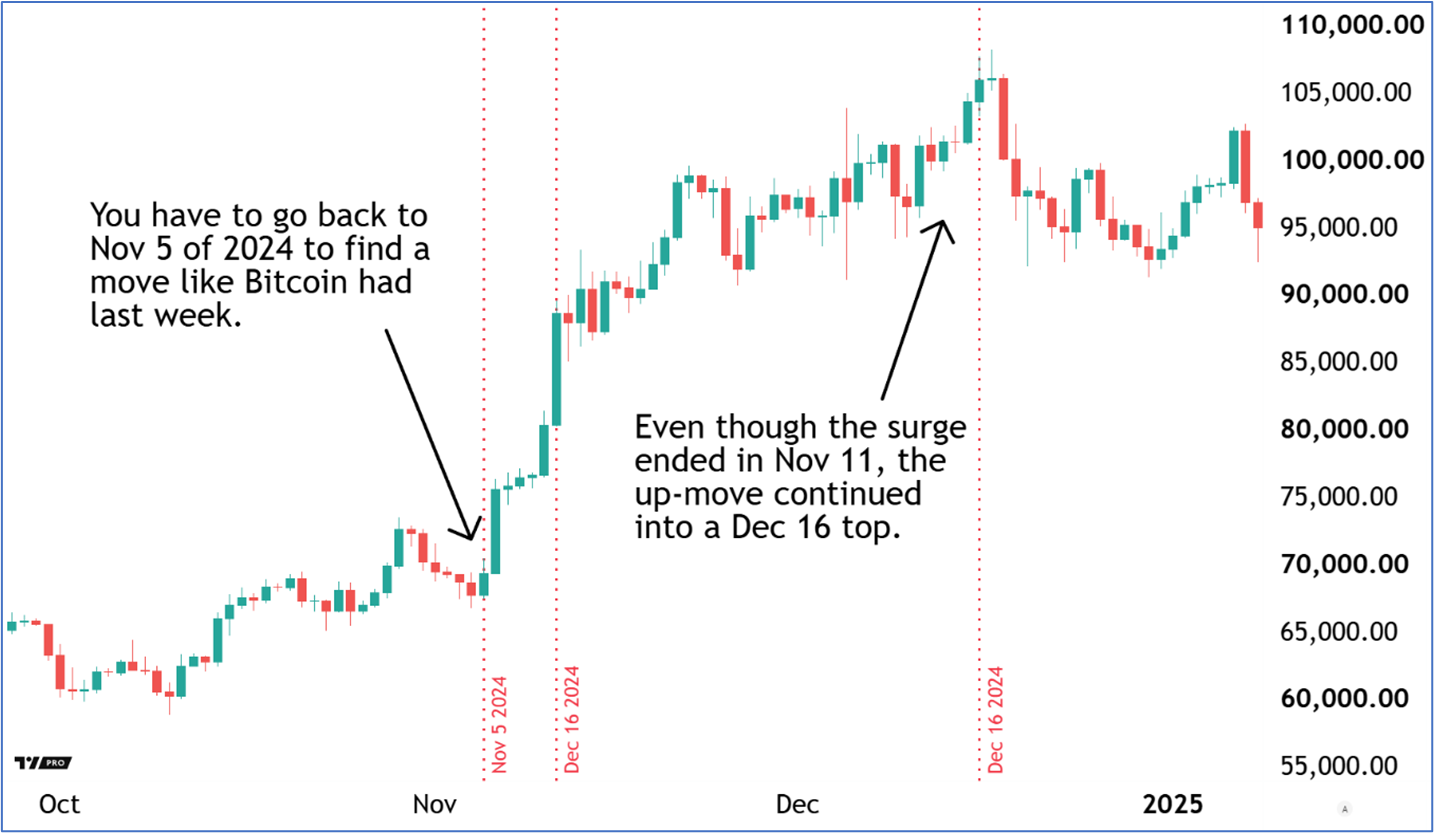
Bitcoin’s explosive move started Tuesday, Nov. 5. And the initial burst of momentum lasted about a week, running through Monday, Nov. 11. By that point, BTC was already up roughly 25%.
But it didn't stop there. Bitcoin continued to climb for another month. It didn’t stop until Dec. 17.
In other words, the last time we saw a rally of this magnitude, it wasn't one-and-done. On the contrary, it kept going.
So, here's a question worth asking: If the 4-year-cycle low isn't already behind us, what are we actually saying? That Bitcoin is now going to carve out a fresh, lower low.
OK, let's put some numbers on that to weigh how realistic it is.
As I write, Bitcoin sits near $77,800. Both Japanese M2 (JpM2) and my Forecasting Model point to Oct. 18 for Bitcoin’s next major low.
So, for the skeptics to be right, BTC would have to fall 37% in a matter of weeks.
For context, that’s worse than the Jan. 14-Feb. 5 swoon (roughly 35%) of 2026. Which was Bitcoin’s steepest, deepest dive in years.
This is what today’ skeptics are effectively calling for a repeat of.
Now let's stress-test that outcome against Bitcoin's own recent behavior. Let’s suppose …
- Bitcoin has already topped out. That …
- The down-move that JpM2 has been signaling is already underway. And …
- The next leg down mirrors the second-sharpest correction we've seen so far this cycle: the decline between May 11 and June 21.
Retesting BTC’s June-July Low
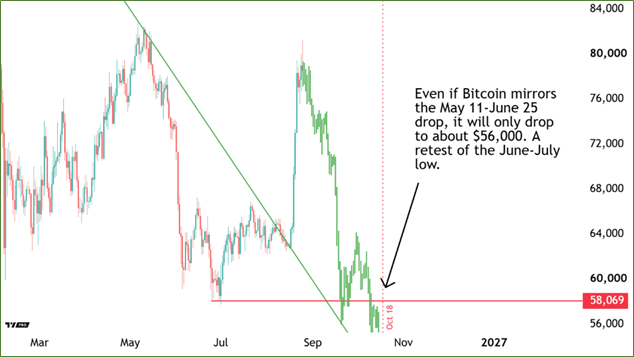
Now, before you say, ‘Why not use the Jan. 14 crash as a reference?’ allow me to give you a cycle reason. The WORST crashes in crypto bear markets happen EARLY in the cycle — Q1 2026, for example.
Not late, as would be the case now.
That’s because, as time goes on, volatility goes down and crashes get milder. That’s been the historical pattern.
In the chart above, the green lines trace out the May 11-June 25 correction, and project it onto the present. Bitcoin would fall to approximately $57,000, as the red horizontal line shows.
That's essentially a retest of the June 25/July 1 low. Not a meaningful new low. Not the $50,000 breakdown today’s pessimists keep bracing for.
In other words, even if we assume Bitcoin is about to repeat one of its sharper corrections of the entire cycle … the result still wouldn’t produce a significant new low.
What people are actually calling for — whether they realize it or not — is a crash unlike anything we've seen even during this bear market.
To be completely fair, it’s not impossible. In crypto, anything can happen.
But it would require a genuinely severe, unforeseen external shock. Something that causes Bitcoin to completely reverse the biggest rally in almost two years. And fall with even greater ferocity than with which it just climbed.
That's not the base case. That's a tail risk.
So, in all likelihood — and barring some dramatic negative catalyst nobody's currently pricing in — the 4-year-cycle low is already behind us.
The math simply doesn't support the alternative.
What does this mean for investors? It means we know where BTC will be trading for the coming weeks.
Right now, $72,000 acts as near-term support, though stronger support sits at that July low. And above, $83,000 acts as resistance.
In between, BTC’s volatility has already given some altcoins their chance to bottom or run. Which means the coming weeks should firmly be considered an accumulation phase.
To see which assets my Crypto Timing Model has focused on for my long-term Weiss Crypto Investor members, click here.
Best,
Juan Villaverde