This Is the Most Bullish Macro Setup in YEARS
 |
| By Juan Villaverde |
This week, all eyes were on the U.S. and Iran as the two-week ceasefire came to an end the morning of April 22.
This is a big deal for Bitcoin (BTC, “B+”). Because the geopolitical headwinds have kept its rally fairly tame.
And unfortunately, the news leading up to the anticipated deadline weren’t particularly encouraging.
As April 22 approached, the U.S. Administration insisted on a second round of talks. Iran adamantly refused. After which, hostilities seemed to resume. Both sides struck commercial vessels attempting to transit the Strait of Hormuz.
But then on Tuesday, President Trump announced the ceasefire would be extended indefinitely. According to him, the extension is because the Iran government was too fractured to come to the table with authority to negotiate lasting peace.
Meanwhile, the U.S. naval blockade remains in force.
The markets cheered the news. Stocks went up. Oil sold off sharply. Bitcoin rallied.
And for keen observers of price action, something even more remarkable unfolded: Risk assets finally began decoupling from crude.
Oil Prices Break Away
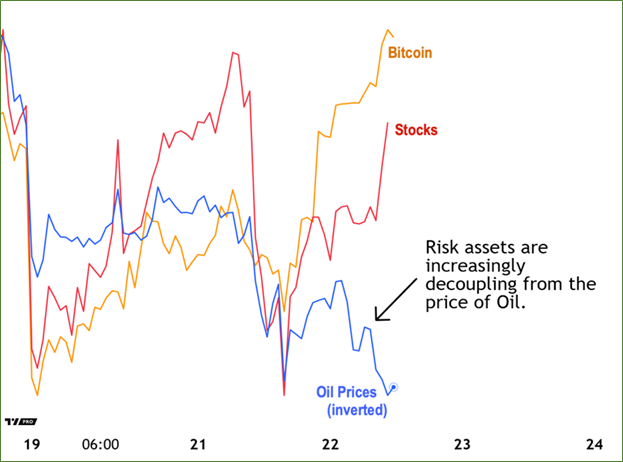
We have been tracking these three assets since the war started. Back in March, it was like looking at the same chart. With all three benchmarks moving in near-perfect unison.
I called this a Correlation 1 moment. However, such moments don’t last very long.
And you're now seeing this one start to unwind above.
Stocks and crypto maintain a loosely correlated relationship to one another. Notice how the red and orange lines still move somewhat together …as oil prices wander off on an entirely separate path.
This is a return to the normal state of affairs. And it’s occurring headline by headline.
It’s also a very positive development for one simple reason. Barring more alarming news out of the Mideast, the macro outlook is the most bullish I’ve seen in four years.
Bitcoin’s 3 Key Macro Indicators
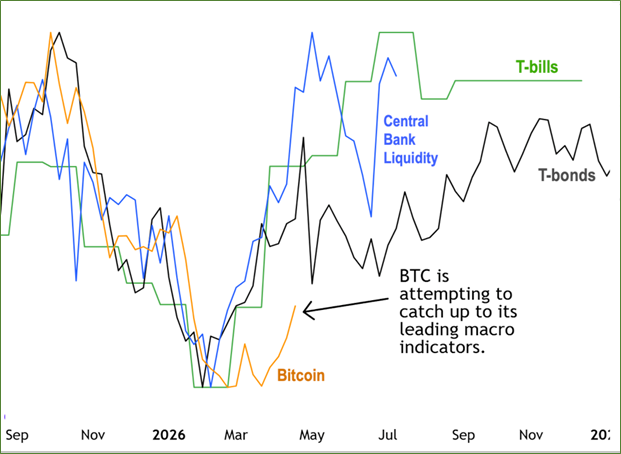
All three show a rally in April and into early May.
Although the green T-Bill supply line gives the market until June to rally, only monthly data is available. Which means it carries the widest margin of error — about two months.
Taking that into account, all three leading indicators agree on one thing: Crypto markets will likely rally into an early-to-mid-May high. From there, we likely see a correction lasting until late June or early July.
Looking back, it appears that the Iran war caused a roughly two-week distortion in the price of Bitcoin as it sold off the second half of March. Whereas macro indicators pointed to a steady rally into May.
JpM2 Picks Up on That Distortion
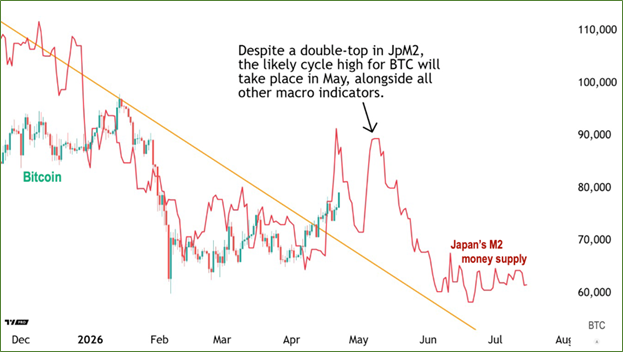
I use the word “distortion” carefully here. Note the double top in JpM2 between this week and early May. Between such tops, a sharp correction takes place.
But this is unlikely, as I've been saying for some time. And for good reason: This correction doesn't show up in any other liquidity or macro indicator I track.
That’s mainly because it stems from Japanese monetary authorities trying to suppress the dollar.
These so-called “Yenterventions” have become commonplace in recent years, as Japan grapples with an unprecedented debt crisis.
But they have had no meaningful impact on Bitcoin. Accordingly, I’m going to disregard the April 21 “Yentervention” top in JpM2. And move on to the next potential high for Bitcoin — which is May 9.
That lines nicely up with the other macro indicators, making May 9 the most likely top of Bitcoin’s current rally. So, for now, there's still time.
And everything is still on track for $80,000 to $85,000 by early May.
Then, crypto will likely correct until the next significant low, which my Crypto Timing Model and key indicators suggest will be over the summer.
The strength of this signal implies it’s likely the 320-day low. While a pullback to BTC’s February low is possible, it isn’t necessary. And at the time of writing, I don’t see enough sell pressure to take us there.
More likely, we’ll see sideways, range-bound trading after the May 9 high.
Which means it could be the official end of crypto winter … and the best buying opportunity we’ll get for a while.
To see firsthand how my Crypto Timing Model can help long-term investors navigate this key window, you can watch my recent briefing here.
Best,
Juan Villaverde
