We Could Be Looking at a New Altcoin Season
 |
| By Juan Villaverde |
I’ve said it before. And I’ll say it again: Central banks have a direct impact on crypto.
That’s because their policies directly target how much liquidity is available in any market.
And until now, I’ve been tracking this change by following global liquidity via the M2 indicator. That is, the total supply of money and credit currently sloshing around the world.
Bitcoin (BTC, “A-”) — and by extension, other cryptos — mimic changes in global liquidity with about a 12-week lag.
But I’ve recently discovered something big. M2 has started to show a few notable divergences from Bitcoin.
That’s because the total global liquidity is too broad a metric to use as a precision indicator.
By narrowing my focus to just central bank liquidity — i.e., how much money central banks are pulling or putting into the market — I’ve found a far more precise leading indicator for Bitcoin.
So, what does this indicator say?
That central bank liquidity is finally on the rise again.
Bitcoin’s New Closing High
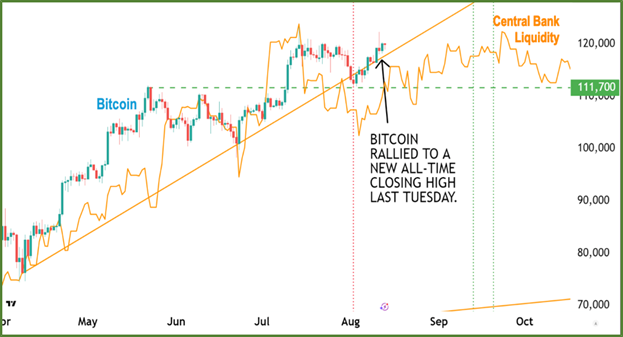
You can see I’ve charted both the price of BTC — in blue — and central bank liquidity — in gold — above.
And you can see how well aligned both are.
Even more interesting is how in sync central bank liquidity is with my Crypto Timing Model. Both anticipated a low around Aug. 3–4, (highlighted by the dotted red vertical line).
The actual low occurred Aug. 3.
From there, Bitcoin broke out to new highs, with a record close last Tuesday.
So, how long can we expect this rally to continue? Liquidity shows a peak sometime in late September.
My Crypto Timing Model says the top will likely come between Sept. 13 and 20, with the latter being the more likely date. The two dotted green vertical lines mark this date range.
Between now and then, expect generally rising crypto prices.
Bitcoin Weakness Nonetheless Persists
Despite market bullishness, Bitcoin’s present advance has been unusually anemic.
In fact, this is the first time in Bitcoin’s trading history that so many 80-day-cycle breakouts have occurred in such a tight range.
The reason might have something to do with this:
Ethereum Also Decouples
Ethereum’s (ETH, “A-”) blistering rally has lately been sucking all the air out of the room in crypto circles.
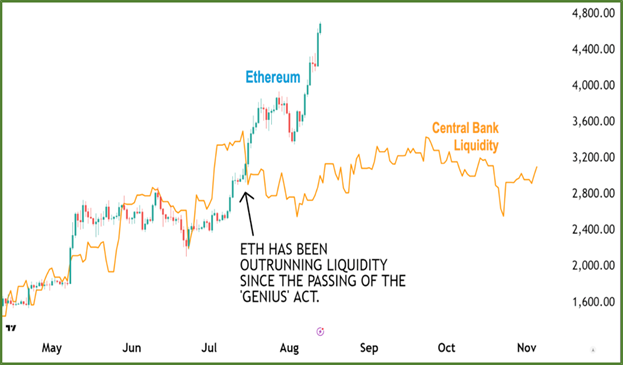
In “normal” times, ETH is even more closely correlated with central bank liquidity than Bitcoin.
But as you can see, something big happened in mid-July — when the GENIUS Act passed.
Since then, Ethereum has been positively on fire. And it has decoupled almost entirely from central bank liquidity.
We’ll dig into this more in a future issue. For now, note that on most major crypto exchanges, Ethereum is now the top-traded asset by volume — stealing the spotlight from Bitcoin.
This isn’t unprecedented.
It’s happened before during bull markets. And when it does, Bitcoin usually lags behind and is pulled higher by Ethereum … at a noticeably slower pace.
In other words, as attention and trading volume gravitate toward Ethereum, Bitcoin is left somewhat in the shadows.
Does that mean we’ll definitely get an altcoin season?
Not quite.
The key test will be whether Ethereum can break above the significant $5,000 level. If it can, the momentum will likely spill over onto other altcoins.
And that could be the ignition point for a full-blown “alt-season.”
If liquidity rotates back into Bitcoin before that happens, however, then we’ll likely have to wait longer to see significant action in the altcoin market.
As an investor, you’ll have to adopt a tactile approach to this market. That way, you’re ready to ride whichever wave you can catch.
Best,
Juan Villaverde
