 |
| By Bob Czeschin |
The M2 money supply includes cash, coins, checking accounts, savings and money-market account balances.
And last week, it hit another new all-time high — above $22.2 trillion.
M2 made a key prior high, you may recall, back in April 2022. When Biden White House officials feared post-COVID inflation could put voters in a foul mood in an election year.
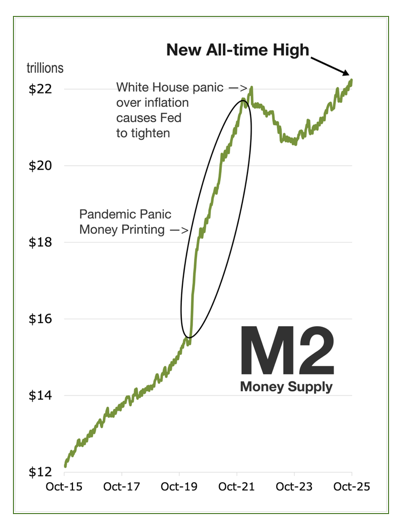
So, they leaned on the Federal Reserve to tighten monetary policy.
Now, however, it’s very clear that the post-pandemic decline this ushered in is over. M2 is growing about 5% a year and has lately been making new highs almost weekly.
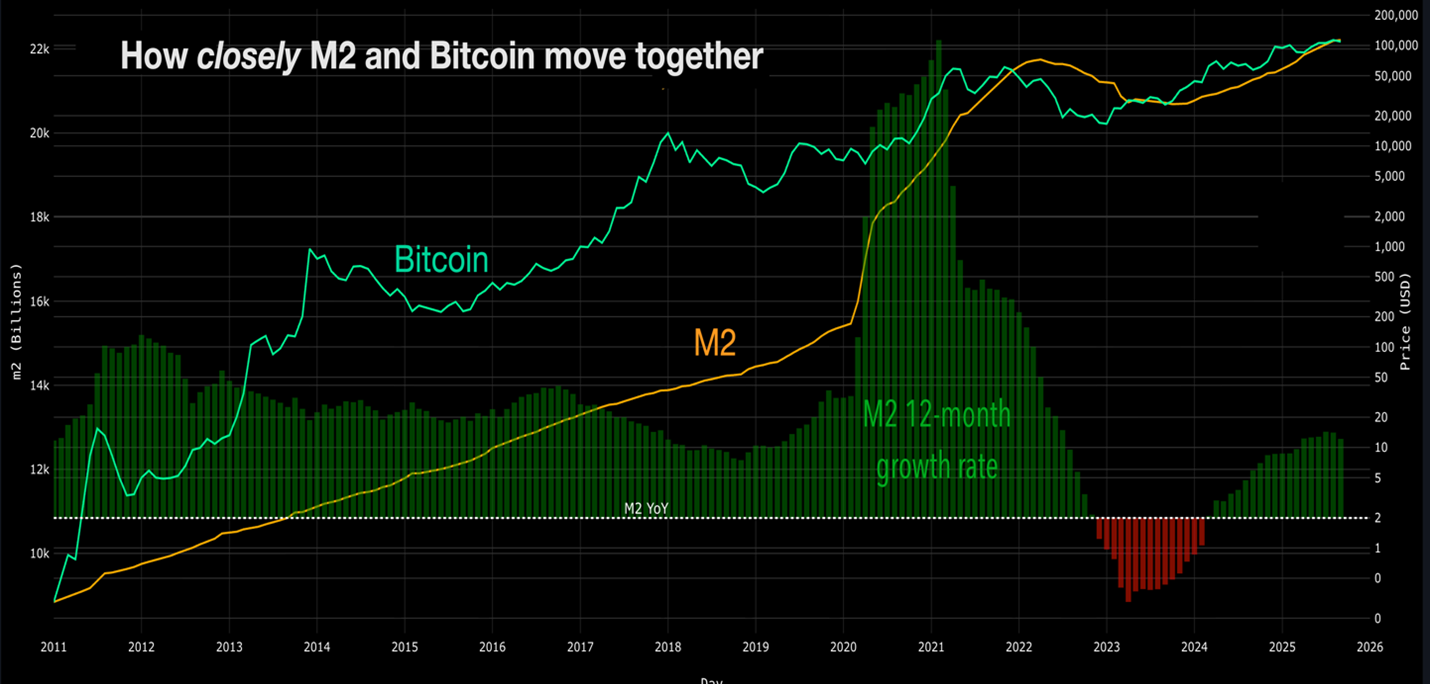
And a growing M2 money supply normally correlates very well with rising crypto prices.
On top of that, the Fed has embarked on a new round of interest-rate reductions — with quarter-point cuts in September and October, and another tentatively on the calendar in December.
But this time is very different from prior rate-cut cycles. In the past, the Fed would lower interest rates when:
- the economy faced recession, or was already in one,
- inflation was low or falling and …
- the stock market was weak, inexpensive and far from overvalued.
Today, the precise opposite is the case:
The economy is relatively strong. Over the past 12 months, real growth has averaged out at 2%. And that’s with only 4.3% unemployment.
Meanwhile, inflation is running above the Fed’s 2% target. In fact, it’s above 3% and could rise further as disruption of global supply chains and rising tariffs put upward pressure on prices.
And the stock market isn’t slacking, either. The AI bubble, for example, is so frothy that old timers like me can’t help but see the shadows of the Dot-Com mania dancing in the background.
In other words, it is quite clear neither the economy nor investment markets need a boost from lower interest rates to keep going.
That those cuts will likely come anyway … would normally make an especially explosive cocktail for Bitcoin (BTC, “A-”).
There’s just one problem.
Crypto markets appear to be nearing the
end of their roughly 4-year cycle.
And as Bitcoin looks likely to continue its corrective phase, its correlation to various measures of liquidity changes substantially.
Just look at how it holds up against one of its strongest indicators, central bank liquidity (CBL).
According to research by cycles expert and Weiss Crypto Portfolio editor Juan Villaverde, CBL is an even more useful leading indicator than M2 alone.
That’s because it cuts out a lot of the retail-driven noise to focus only on new liquidity entering the market and old liquidity leaving the market.
That means it can more reliably track Bitcoins’ price path about 84 days in advance.
That is, except when Bitcoin gets close to a four-year cycle top.
Instead of CBL leading Bitcoin by 84 days, sometimes Bitcoin leads CBL when it comes close to its four-year-cycle top.
That happened in late 2013 and 2017. Other times they top out together, which is what happened at …
Bitcoin’s November 2021 Top
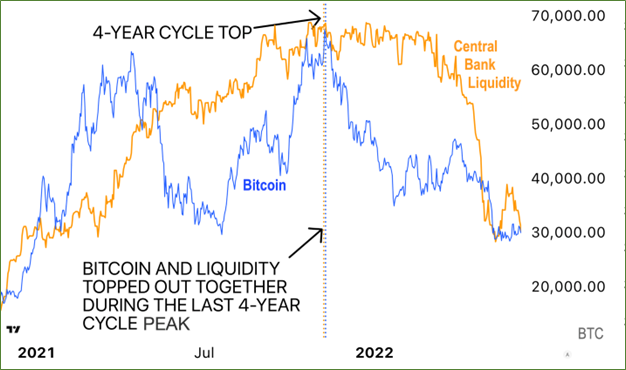
As you can see, Bitcoin and Central Bank Liquidity moved together around the time of Bitcoin’s last confirmed four-year-cycle peak.
The takeaway for the current cycle is straightforward: Bitcoin starting to lag Central Bank Liquidity by fewer than 84 days … could signal an incoming four-year-cycle top for crypto.
That takes me to what’s happening now …
Bitcoin and Central Bank Liquidity Today
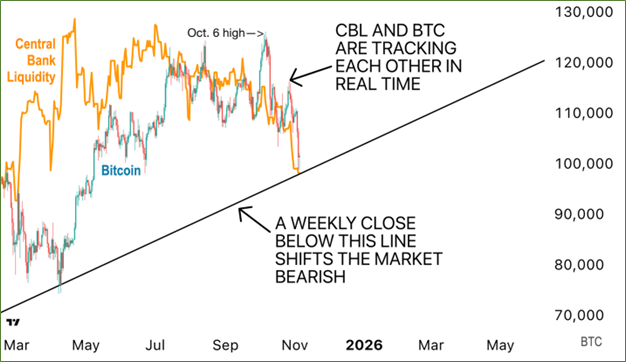
As you can see, Bitcoin is no longer following liquidity with a delay. Instead, it’s reacting in real time. Just as it has during the past four-year cycle peaks.
And that brings me back to M2.
Despite M2 hitting record levels and the Fed cutting interest rates, CBL is still trending lower — with no visible sign of a rebound yet.
Remember, CBL is a more accurate Bitcoin indicator than M2.
So, what does this mean for Bitcoin?
In the short run, BTC will likely remain directionless, with a heightened risk of further downside.
I understand this would not be good news. But as every investor knows, periodic bear markets are inevitable.
Crypto asset prices are fundamentally cyclical. Which means, sometimes, they go down.
That said, there are two critical points you need to understand about this setup.
First is, as I said, the cyclical nature of crypto. What goes down will come back up, which means corrections like this give investors the ability to set themselves up to maximize returns on the way up.
You can do this by waiting for the bottom to load up, or by dollar-cost averaging existing positions on the way down.
Second is the change we’ve seen in the market throughout 2025.
Institutions have flooded into the crypto market. And while their funds shot Bitcoin above $100,000 for the first time ever — and kept it there for months — they also fundamentally change how crypto is traded.
Crypto’s wild swings — to new highs or to devastating lows — are becoming less frequent. And the ones we do see are far shallower.
I expect this pattern to continue with the 4-year cycle correction. Which means it’s likely the next down phase may not resemble a traditional crypto bear market at all.
Indeed, Bitcoin could stabilize between $70,000 and $90,000 for several months, moving sideways in that range — before the next bull leg begins.
That would represent a 30-45% drop — far milder than past bear markets, which often took BTC down as much as 80%.
On top of that, the liquidity outlook for 2026 is actually quite positive.
That gives long-term investors a light to focus on as we move into the end of 2025 and the beginning of 2026.
(To learn what Juan Villaverde’s long-term plan for Bitcoin is — and how his Weiss Crypto Investor Members will navigate this correction — click here.)
And for traders, Bitcoin’s primary 80-day cycle still operates even in a bear market.
Which means there will be tradeable rallies while you wait for crypto’s next explosive bull run … for traders tactile enough to find them.
Best,
Bob Czeschin