Your 2 Most Pressing Bitcoin Questions, Answered!
 |
| By Juan Villaverde |
The most frequently asked question I get these days is: How confident are you Bitcoin will keep rallying?
Answer: Extremely confident!
And the reason is not in the least mysterious.
In fact, I’ve been saying the same thing for a month. But it bears emphasizing: Global liquidity has been rising since the start of the year — with no sign of any material slowdown.
Crypto markets typically feel the pull of changing liquidity after about a three-month lag. And crypto has only just bottomed.
Accordingly, we should at least see abundant upside into June, giving us a couple more months of runway.
To see why, take another look at the chart I shared last week:
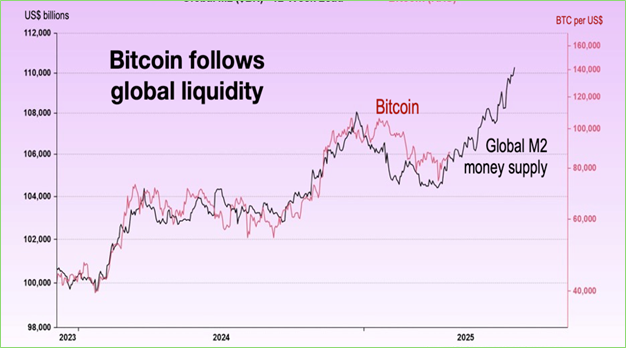
As you can see, global liquidity (the black line) has already been climbing for some time. While Bitcoin (BTC, “A-”), marked by the red line, has only now started to catch up. In other words, this rally has legs.
How high could it go?
Well, rising liquidity is unabashedly bullish. However, this upward pull cannot escape influence from macro factors, such as tariff uncertainty and trade wars.
Moreover, such a thing is hardly unprecedented. In 2021, for example, global liquidity kept rising into March 2022. Yet, Bitcoin already started turning down the previous November.
That was due to rate-hike expectations.
The Federal Reserve signaled looming hikes in December 2021. But market chatter had already started anticipating tighter money in November.
So, Bitcoin simply priced in the coming liquidity drain ahead of time.
I see a similar dynamic in 2025. Only now, the wild card isn’t Fed rate cuts. It’s the Chinese yuan exchange rate.
Price of 1 USD in Yuan
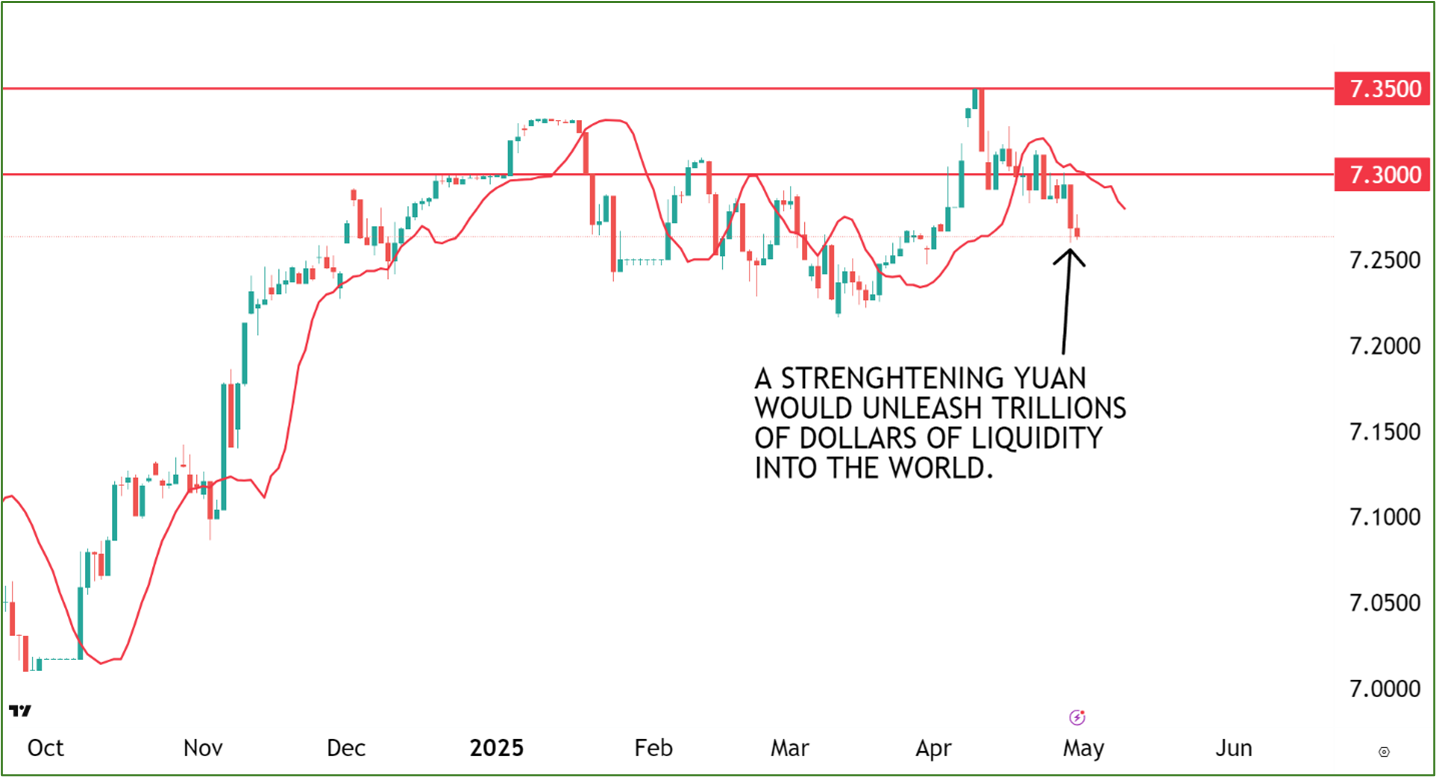
The two red horizontal lines (7.30 and 7.35 yuan per $1) define what I call Beijing’s threshold of pain.
China faces a deflationary bust broadly similar to what Western nations confronted during the 2008 financial crisis. The way out is for the People’s Bank of China (PBoC) to print trillions of yuan.
However, such determined money-printing would utterly crush the yuan on world currency markets. And this is a big red line for Party bosses.
So, Beijing’s practice since 2022 has been to print aggressively only until the yuan hits the pain threshold. And then, pause.
Indeed, you can see echoes of China’s stop-and-start money-printing in the on-again, off-again character of the current crypto bull market. Following crypto’s November 2022 low, we’ve had a rousing rally, a long pause, another robust rally, and another long pause.
And now, Trump comes along, stirring tariff uncertainty and a possible Sino-American trade war into the macro-economic mix.
And that leads me to the second most asked question I get: How high can Bitcoin go?
Of course, no one can say with certainty. But I see two potential outcomes:
The first is if triple-digit tariffs on both sides remain in place. In that case, the yuan probably won’t rally much. Global liquidity growth will stall. And so will the crypto bull market.
If this happens, we could see prices just north of the previous all-time high, near $110,000.
But what if Washington and Beijing strike a deal to let the dollar weaken meaningfully against the yuan — something the Trump White House also says it wants — we could see an alternative result.
In this scenario, Beijing can print freely to bail out its banking system and inject trillions into the global economy along the way.
That would certainly light a fire under crypto assets … and take Bitcoin at least to $150,000 by October. And possibly higher.
So hold tight. Things are just starting to heat up.
Best,
Juan Villaverde
