 |
| By Jordan Chussler |
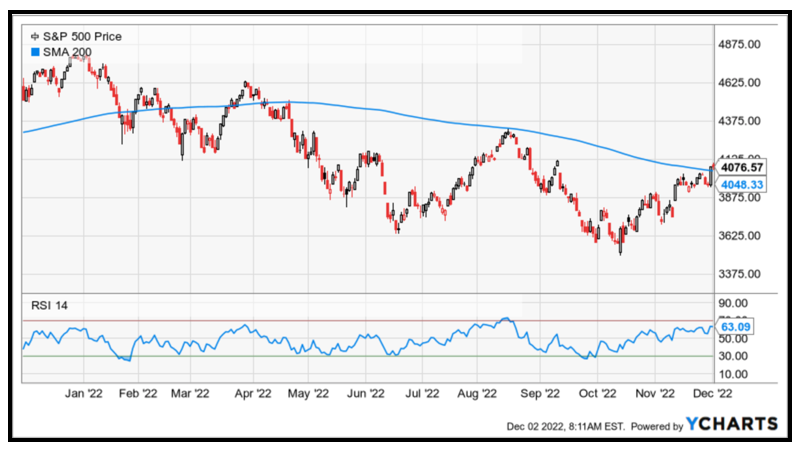
The last time the S&P 500 challenged its 200-day moving average — largely considered the threshold of a bear or bull market — was in mid-August.
It failed to break through and subsequently shed 16% by mid-October.
Since then, the market has once again rallied, recovering nearly 14%. As of yesterday’s close, the index pushed through the 200-day MA and is eyeing an end-of-year reversal to 2022’s bear market.
Click here to see full-sized image.
And while the recent gain has many asking if this is the end of the bear market, the rally could be short-lived.
The relative strength index — a momentum indicator — shows the S&P pushing toward an RSI of 70, or what is considered overbought territory. The last time it reached 70, in August, it reversed and sharply went lower.
However, whether this rally is sustainable is yet to be determined. The market could correct, as we’ve seen it do three times this year after challenging the 200-day MA in March, April and August.
Or, bolstered by various macroeconomic data points, like today’s much stronger-than-expected jobs report, momentum could continue into the final weeks of the year.
For a better understanding of why this time could be different, here are five factors providing perspective on current conditions shaping the present rally.
Factor No. 1: Jobs Report
Payrolls and wages blew past analysts’ expectations, with this morning’s report evidencing nonfarm payrolls growing by 263,000 month over month, while the unemployment rate sits at a healthy 3.7%.
Payroll estimates of 200,000 were a miss, and hourly earnings jumped 0.6%, doubling the estimate.
All of this is indicative of a strong labor market, which should bolster consumer confidence and spending into 2023.
Factor No. 2: Holiday Sales
Black Friday and Cyber Monday shoppers spent a record $9.12 billion and $11.3 billion during the respective days.
Online sales dominated, while Black Friday and Cyber Monday sales jumped 2.3% and 5.3% year over year. Some 196 million people shopped over the weekend, topping estimates by over 30 million.
However, the sales figures are not adjusted for inflation, indicating that consumers are buying less for more.
Factor No. 3: Inflation Possibly Peaking
In addition to positive news from last month’s Consumer Price Index and Producer Price Index readings, the U.S. personal consumption expenditures, another gauge of inflation, rose less than expected in October.
Headline PCE increased 0.2% monthly and 6% annually, providing additional indication that inflation could be peaking. Core PCE, one of the Fed’s preferred inflationary readings, simmered down to a 5% annual increase.
The 6% yearly PCE increase is its lowest level since December 2021. It peaked at 7% in June.
The data follows favorable CPI and PPI readings from weeks ago and gives further cause for the Fed to consider dialing back its rate hikes.
Factor No. 4: Fed Hints at Slowing Hikes
On Wednesday, Federal Reserve Chairman Jerome Powell delivered a speech that signaled smaller rate hikes moving forward.
Specifically, Powell said, “The time for moderating the pace of rate increases may come as soon as the December meeting.” The S&P 500 responded by jumping 3.2% immediately following the speech.
The Fed Fund futures now price in a 77% chance of a 50-basis-point rate hike after the next meeting on Dec. 14.
Factor No. 5: Mortgage Rates Cooling
Mortgage rates continue to decline as investors price in the Fed taking its foot off the gas.
According to Bankrate, the average 30-year fixed mortgage fell another 17 basis points over the past two weeks to 6.67%, marking the third consecutive week rates declined.
However, demand is still dropping. Application volume fell 0.8% last week despite the average 30-year fixed mortgage rate for conforming loan balances of less than $647,200 falling to 6.49%.
Mortgage applications for home purchases increased 4% over last week, but they’re still 41% lower than the same period last year.
Click here to see full-sized image.
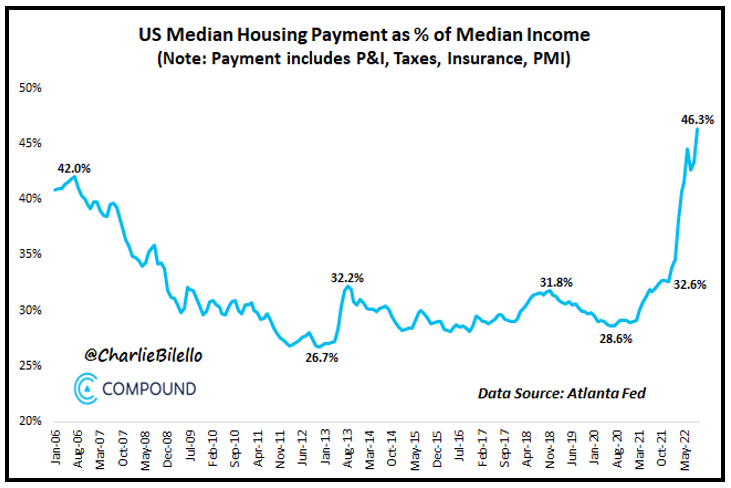
Housing prices are at their least affordable level when comparing the median housing payment and median income since the data was tracked in 2006.
At current interest rates, prices and income levels, a person making the median U.S. income would need to spend 46.3% of their income to afford the median housing payment.
With the S&P 500 closing above its 200-day moving average for the first time since April, breaking through that level of resistance is a positive sign and could signal further momentum.
The market could turn lower if it stumbles like it did in August, but for now, the bulls appear to be winning in the fourth and final quarter of the year.
To see how this plays out over the next four weeks, keep your eye on the S&P’s RSI, forthcoming macroeconomic reports and your issues of Weiss Ratings Daily.
Until next time,
Jordan Chussler
Managing Editor
Weiss Rating Daily
P.S. Investors who are interested in receiving tailored picks to help navigate this tumultuous market should consider Senior Analyst Tony Sagami’s trading service, Disruptors & Dominators. Members are enjoying open gains of 46%, 36% and 27% despite this year’s bear market. Click here to learn more.