 |
| By Jordan Chussler |
One morning last month, my colleague and I were speculating about whether a top was in for the S&P 500.
The index had been on a tear since mid-June when it began regaining 74% of its year-to-date losses. And through the dog days of summer, the S&P’s potential recovery spurred plenty of chatter about the possibility of a newly emerging bull market.
Hindsight’s 20-20, though, and we now know it was just a bear market bounce, which has had the short crowd rejoicing since.
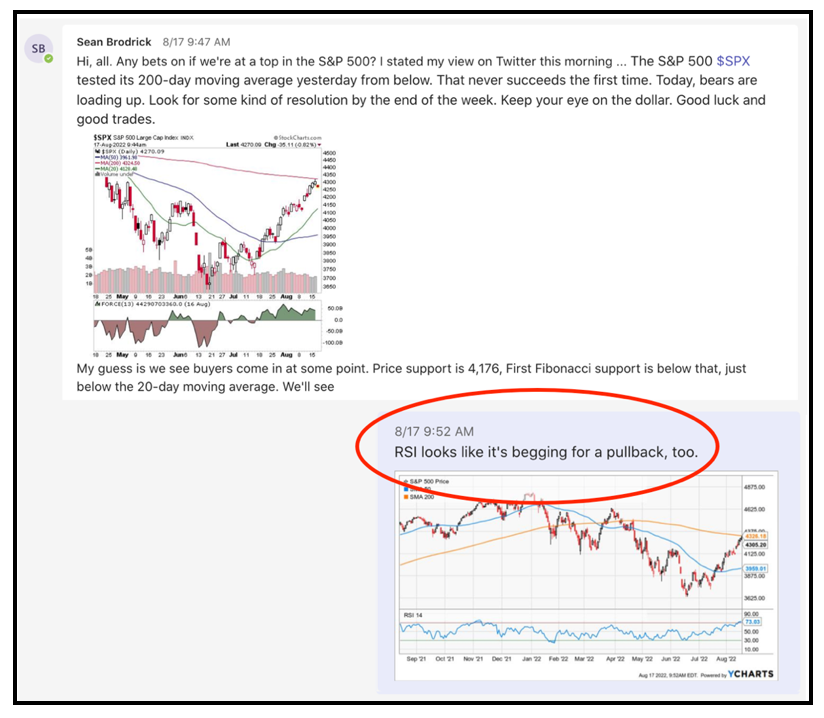
But in that mid-August conversation with Sean Brodrick, investment analyst, cycles expert and editor of Wealth Megatrends, we delineated all the reasons we suspected it was not, in fact, an emerging bull market.
And we did so before the writing was on the wall. Sean had his reasons and I had mine:
Relative Strength Index
There’s no shortage of indicators when it comes to technical analysis. From simple moving averages to more complex Bollinger Bands, investors and traders interested in conducting their own technical analysis have a litany of tools at their disposal.
However, understanding when to properly deploy them is critical. I prefer turning to the relative strength index, or RSI, when it comes to identifying the terminus of a rally or pullback.
RSI is a momentum indicator that’s a measure of relative strength. Simply put, it gauges whether a stock, fund or index is oversold or overbought. By plotting scores between 30 and 70, RSI suggests a likely direction for a given equity. Anything near or over the 70 mark implies it’s either approaching or has entered overbought territory. Anything near or below 30 suggests it’s close to or already is oversold.
These metrics can be extrapolated to determine the likelihood of price action. Going back to my mid-August conversation with Sean, the S&P 500’s RSI immediately caught my eye. It was just beginning to push above 70, suggesting the index was topping out.
Click here to see full-sized image.
From the high of its dead cat bounce on Aug. 16 when the RSI pushed over 70, the S&P proceeded to drop over 9% by Sept. 6.
Physics & Finance
Physics and finance typically don’t overlap. You’d be hard-pressed to find a financial planner who can explain quantum field theory, or a physicist who can describe aggregate market analysis. But in this instance, the two fields intersect.
Think back to your days in the science classroom, and specifically to Newtonian physics. I’m sure you remember, even if vaguely, Newton’s laws of motion. Specifically, his third law states that:
“When two bodies interact, they apply forces to one another that are equal in magnitude and opposite in direction. The third law is also known as the law of action and reaction. This law is important in analyzing problems of static equilibrium, where all forces are balanced, but it also applies to bodies in uniform or accelerated motion.”
In short, for every action, there is an equal and opposite reaction.

Click here to see full-sized image.
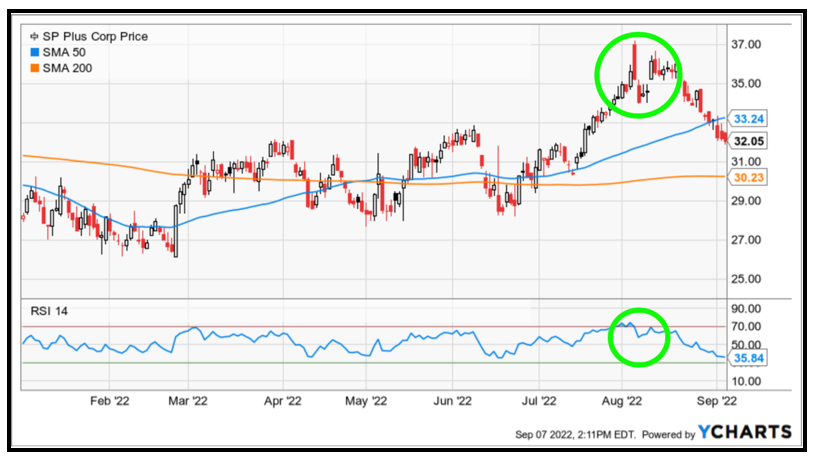
Similarly, when the RSI shows an index, fund or stock topping or bottoming — and indicating a likely reversal in its price trend — there’s usually an inverse fund that’s doing the exact opposite.
Shorting … the Easy Way
Back in June, before the S&P began its short-lived bounce, I wrote about inverse exchange-traded funds and how they can be used to short various sectors.
Inverse ETFs produce returns when the value of the underlying benchmark decreases, which is similar to holding various short positions at once. In this instance, when the S&P 500’s RSI was indicating the index was overbought, there were inverse funds proving Newton correct.
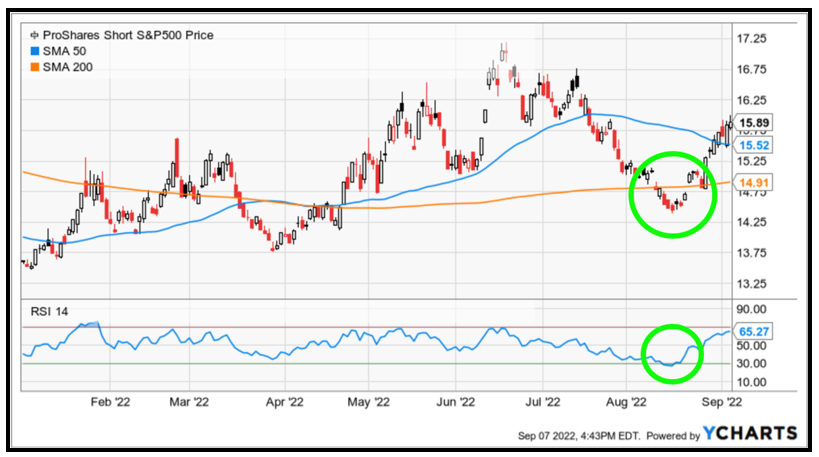
One such fund is the ProShares Short S&P500 (SH), which seeks to return -1x the return of the S&P 500. If the S&P goes down, the SH goes up.
Analyzing the RSI of the ProShares Short inverse ETF at the same time that the S&P 500’s RSI was pushing over 70, you can see it was hovering near 30 — what’s considered oversold.
Click here to see full-sized image.
In the following trading sessions, as the S&P was falling 9%, the SH bounced from an RSI of 30, reversed and surged 9.89% through Sept. 6.
History Repeats Itself
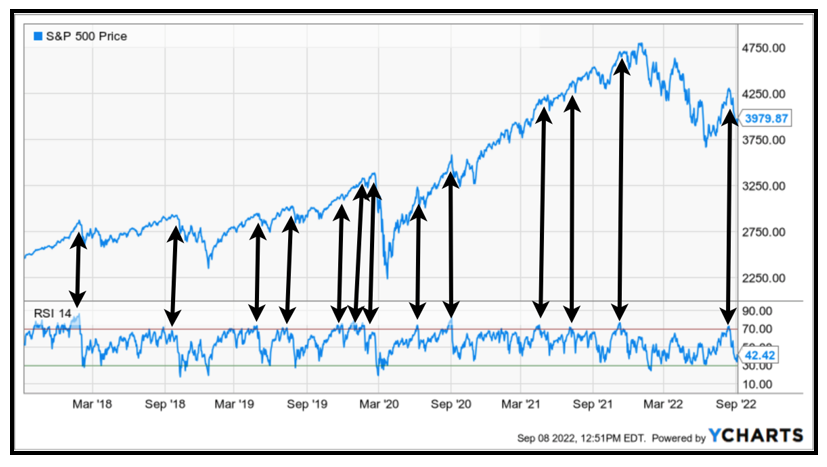
This isn’t an anomaly, either. Time after time, when the S&P 500’s RSI reading pushed over 70, a corresponding pullback or outright correction followed. Looking at the index’s five-year chart, this is demonstrated no fewer than 13 times:
Click here to see full-sized image.
In each of those 13 instances, the S&P pulled back or corrected significantly. In doing so, it provided tremendous opportunity for short- and medium-term investors willing to take on short positions or those who understand the benefits of inverse ETFs.
Using technical analysis, and RSI in particular, doesn’t require a certification in financial planning or a degree in rocket science. But a basic understanding of Newton’s third law — and how action-reaction can be applied to the markets — goes a long way.
If the prospect of technical analysis seems too daunting, consider joining Sean’s Wealth Megatrends. Based on his tailored picks, members are currently sitting on multiple double-digit open gains while being paid substantial dividend yields.
As always, conduct your own due diligence before entering any trade.
Until next time,
Jordan Chussler
Managing Editor
Weiss Ratings Daily