 |
| By Sean Brodrick |
There’s an energy industry that is going to double in the next five years. You can buy it now for cheap. And there’s even a silver lining. Does that sound like something you’d want to invest in?
I’m talking about solar energy.
This year, the U.S. solar industry clocked the fastest growth of any Q1 in history. And it’s just getting started.
As the incentives in the Inflation Reduction Act power up more solar installations, total U.S. installed capacity is forecast to rise to 337 gigawatts by the end of 2028 from 142 GW at the end of last year.
And the silver lining? That’s the metal silver itself, which is in big demand in the solar industry because of its incredible electrical connectivity.
Silver consumption in solar power is forecast to account for 161.1 million ounces this year, a 15% increase over 2022 and a massive 189% increase since 2014.
And that’s just the start of the story. Solar demand for silver is forecast to make huge leaps going forward.
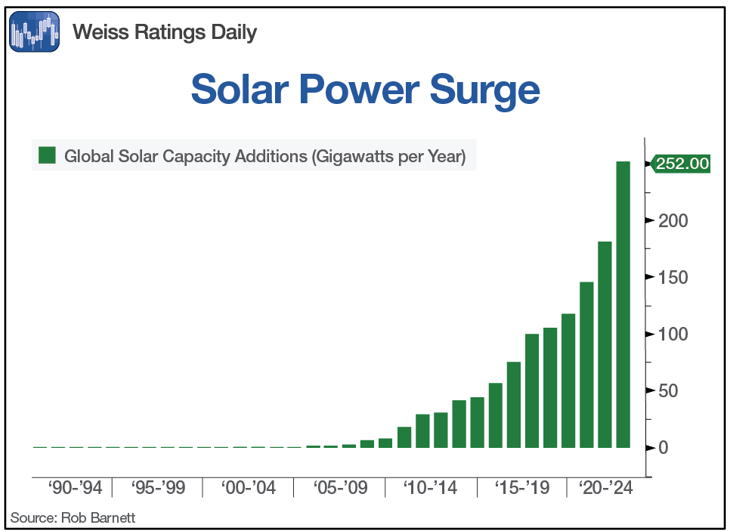
I’ll get to that. First, the solar boom isn’t just happening in America. It’s happening all over the world, as you can see from this chart:
Click here to see full-sized image.
Global renewable capacity additions are set to soar by 107 GW, the largest absolute increase ever, to more than 440 GW in 2023.
China is at the forefront of this. As of Q1 of the year, China’s utility-scale solar capacity has reached 228 GW. That’s more than that of the rest of the world combined.
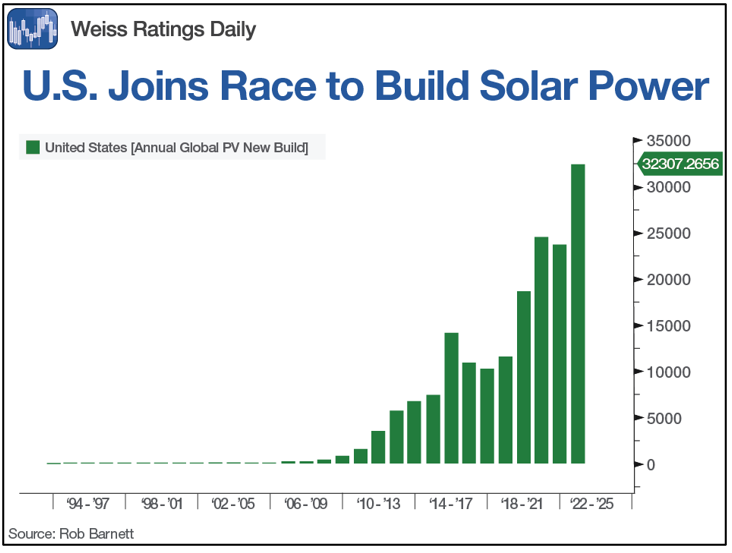
Still, the U.S. is where American investors will make most of their money. And while America is behind China, it’s kicking into higher gear to catch up.
Click here to see full-sized image.
The reason why U.S. photovoltaic builds just shot higher is anticipation of how the Investment Tax Credit and Production Tax Credit for solar are being extended and expanded.
Existing tax credits for solar were winding down and due to expire. The ITC for solar was 26% in 2020–2022, then dropped to 22% in 2023 and it was supposed to drop again to 10% next year. Now, it’s been raised to 30%. That’s a nice bonus for any homeowner thinking of installing solar.
There are more incentives if the solar panels are made here in the U.S. That’s why Canadian Solar (CSIQ) just announced it’s building a solar PV module production facility in Mesquite, Texas. The new plant will have an annual output of 5 GW per year of modules.
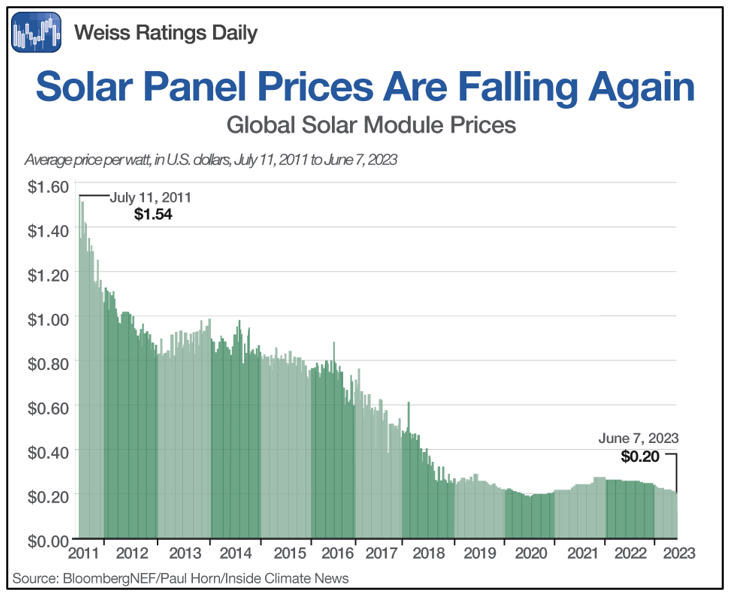
But the Inflation Reduction Act isn’t the only thing solar has going for it. Remember how supply chain bottlenecks disrupted everything during the pandemic? Well, those bottlenecks are over, supplies are getting through and solar modules are getting cheaper again.
Click here to see full-sized image.
Now, some experts are predicting the prices of solar modules will drop 10% per year for the next decade. It’s fast becoming the cheapest energy source around.
That means we’ll see more solar power built and installed, and that means more silver demand.
To be sure, solar power manufacturers are getting more sparing in how they use silver in solar panels. Even so, in 2022, photovoltaics consumed 140.3 million troy ounces of silver.
That was a 27% increase year over year, and works out to 28% of total industrial demand. In 2023, the Silver Institute forecasts solar industry demand for silver will rise to 161.1 million ounces.
Meanwhile, the World Bank is looking further ahead. The World Bank says demand for silver in solar could reach about 50% of 2019's total silver demand by 2050. That translates to consumption of 500 million ounces for solar alone.
That sure sounds bullish to me — for both solar and silver.
2 Ways to Play This
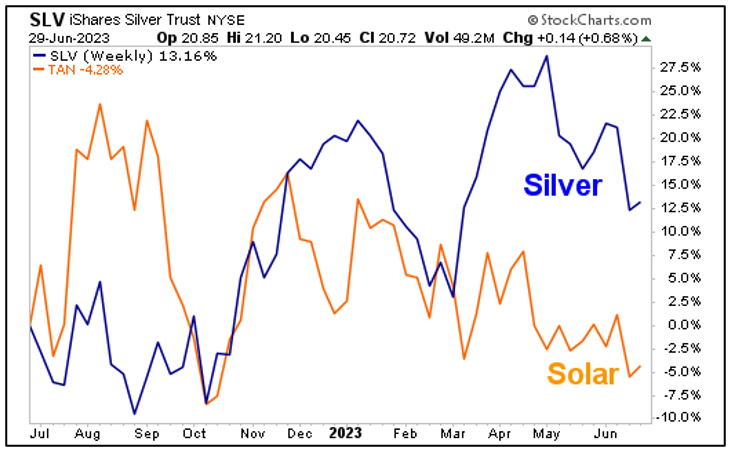
You could play this with the Invesco Solar ETF (TAN). It has an expense ratio of 0.69% and tracks a basket of the best solar stocks. Or you could also buy silver using the iShares Silver Trust (SLV). It has an expense ratio of 0.50% and tracks physical silver. Let’s look at a one-year percentage chart of the price action in both.
Click here to see full-sized image.
In the past year, SLV is up 13%. TAN continues to drag … for now. The recent bullish action in solar demand, construction and tax incentives may power up stock prices sooner than later.
So, you can bet on the one that’s already rallying — silver — or place a riskier bet on solar, for potentially higher reward. One thing’s for sure. The solar power industry is storming ahead. And it has a nice silver lining for metals investors.
Beyond ETFs, if you’d like my tailored stock picks in metals and other resources, consider joining my service, Resource Trader. Since the start of 2022, members have enjoyed 26 double-digit gains in metal, mining and other natural resource stocks. Click here to learn more.
All the best,
Sean