Gold Is Telling You What Your Dollar Is Really Worth

 |
| By Sean Brodrick |
Want to know what inflation really looks like?
Set aside the Consumer Price Index for a minute and measure your paycheck in gold.
The chart below does exactly that. It divides the price of an ounce of gold by average hourly earnings to calculate how many hours the average American must work to buy one ounce.
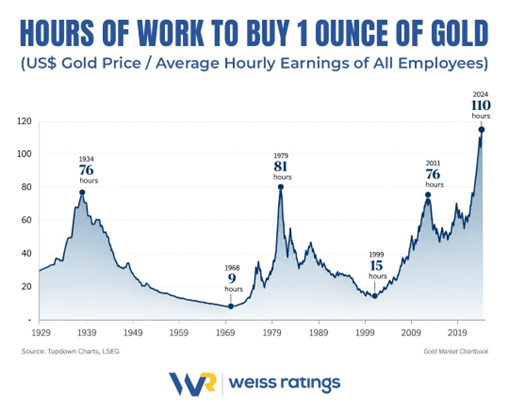
You can see that in 1934, it took 76 hours of work to buy an ounce of gold.
By 1968, it took just nine.
Then came the inflationary 1970s. By 1979, an ounce of gold cost 81 hours of labor.
Gold subsequently spent two decades in the wilderness.
In 1999 — near the bottom of gold's great bear market — you could buy an ounce for just 15 hours of work.
By 2011, that had rocketed back to 76 hours.
And in 2024? 110 hours.
Put another way, measured in gold, an hour of American labor lost about 86% of its purchasing power between 1999 and 2024.
Now, I’m not saying the dollar itself lost 86% of its value.
This is a comparison between wages and gold, and gold went from historically cheap in 1999 to historically expensive in 2024.
But that's also the point.
Inflation You See — And Inflation You Don't
The government measures inflation by tracking a basket of consumer goods and services.
And that inflation is real enough.
The latest CPI data show that consumer prices have roughly doubled since 1999.
The CPI stood around 167 in 1999. By August 2026, it was nearly 335. FRED
In other words, something that cost $100 around the turn of the century costs roughly $200 today.
But CPI doesn't tell you everything about the declining value of money.
Asset inflation can be even more brutal.
Houses, stocks, land, collectibles and, yes, gold can rise much faster than consumer prices.
If your wages don't keep pace, you may be getting raises in dollar terms while falling further behind the assets you’re trying to buy.
That's the purchasing-power squeeze this chart captures.
Make Gold Work for You
This is why I believe everyone should have some exposure to gold.
Sure, gold doesn't pay interest.
It doesn't produce earnings.
And it certainly doesn't rise every year.
What it can do over long periods is reveal how much purchasing power a currency has lost.
You don't need to buy gold bars and bury them in your backyard, either.
One of the easiest ways to get exposure is the SPDR Gold MiniShares Trust (GLDM).
It is designed to track the price of gold bullion, less expenses, and charges an expense ratio of just 0.10%.
That’s much cheaper than the 0.40% expense ratio of the more famous bullion tracker, SPDR Gold Shares (GLD).
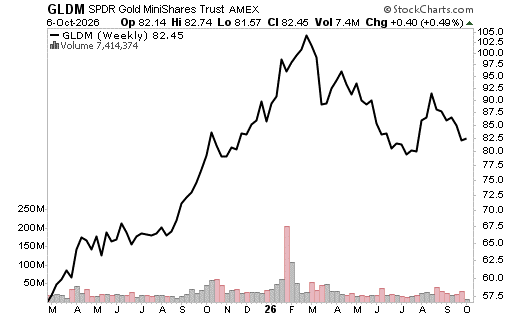
GLDM is also cheaper than GLD. The former’s shares trade just around $82, while GLD trades near $375.
And both are a heckuva lot cheaper than a troy ounce of gold, which goes for more than $4,000.
Speaking of bullion, you can buy gold for cheaper than you could at the start of the year.
But whether gold is up or down this month isn’t really the point.
The chart above shows why it deserves a place in a long-term portfolio.
Dollars come and go. Their purchasing power rises and falls.
Gold is still gold.
All the best,
Sean