 |
| By Jon Markman |
If you're an average investor, the odds are everything you think you know about trading stocks is wrong.
Most investors believe stock prices are the result of some mixture of financial ratios, executive team acumen and investor sentiment.
But that’s not right.
In reality, price is everything — and the rest is simply investor rationalization.
In this issue — the first installment in a series — I'm going to show you:
- How to identify one major price reversal pattern.
- What it means.
- And why it is so reliable.
Let's begin by addressing the elephant in the room. There is an entire ecosystem built around the myth that stock prices can be predicted, assuming you are following the correct economists, investment strategists and professional money managers. This is just a lot of …
Wall Street Malarkey
Peter Lynch, the legendary Magellan fund manager who averaged 29.2% annual returns during his 13-year tenure at Fidelity, often said he never met an economist who was a successful investor. In fairness, predicting stock prices based on macroeconomic factors such as interest rates and aggregate corporate earnings is tough. There are simply too many moving parts.
Collectively, investment strategists and professional money managers have no history of beating even the unmanaged benchmark indices. A 2022 study by S&P Dow Jones Indices found that not a single mutual fund managed to regularly beat the S&P 500 over a five-year period.
The problem for pros is that stocks can advance during even the direst circumstances and decline when all the macroeconomic and corporate stars seem to align.
In 2020, the S&P 500 surged to a record high, even as 20.5 million Americans sought unemployment insurance and corporate profits plunged to the lowest level in a decade.
By 2021 strategists were wildly bullish. Shares of Nvidia (NVDA), a cutting-edge semiconductor firm, catapulted from $125/share to $350/share, garnering 96% "Buy" ratings. One year later with shares at $113, the same analysts were talking about a glut of semiconductors and why the stock might be a good source of funds.
There is a consistent theme: Professionals rationalize their investment expectations based on prevailing price trends. They assume that the prevailing trend will persist indefinitely.
A Better Strategy
Instead, a better strategy is identifying time-tested reversal patterns. Let me share the best of these: The head and shoulders pattern.
This is the part where the detractors will argue that technical analysis — the study of price patterns — does not work. Bear with me.
Price is everything, and patterns do repeat, for obvious reasons that I will get into in a moment.
Click here to view full-sized image.
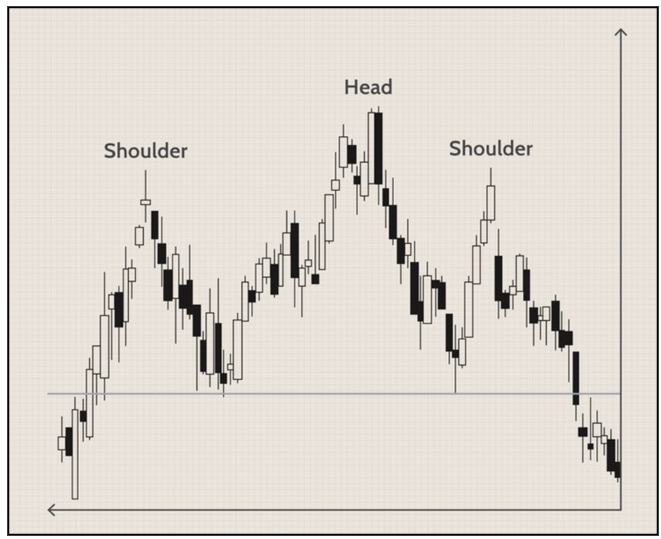
First, you should know that head and shoulders price patterns consist of three price peaks, with the middle (or the head) being the most extreme. H&S patterns also come in two flavors: tops and bottoms.
5 Things to Know
1. This is a reversal pattern, a trend killer. Formations occur at the end of big trends.
2. Patterns can occur in multiple time frames (e.g., hourly, daily, weekly or monthly).
3. The price action reflects the transition from hope to hopelessness, and vice versa.
4. Price stalls then accelerates in the opposite direction despite the prevailing news cycle.
5. The price pattern is self-fulfilling. H&S patterns are widely known by professional traders. The price implications are programmed into automated software.
Now that you understand the basics of H&S patterns, let’s look at some recent examples.
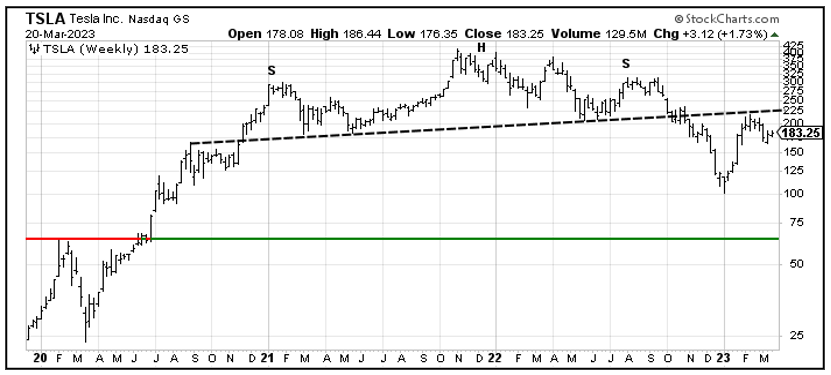
Head and Shoulder Top
Shares of Tesla (TSLA) became the quintessential growth vehicle in 2020, rolling from only $27 in January to $235 by year’s end. During the next two years, the electric vehicle maker grew rapidly. Brisk EV sales pushed revenues sharply. By October 2021, Tesla shares reached an all-time high.
However, the stock price stopped advancing in November 2022 when prices reached $414.50. Fun fact: At that point, the market capitalization of Tesla was greater than the combined values of Ford Motor (F), General Motors (GM), Stellantis (STLA) and Toyota (TM).
The price pattern on the weekly chart, with a distinctive head and two shoulders, became obvious.
Click here to view full-sized image.
Tesla shareholders went from hopeful that the share price would reflect the improving fundamentals to hopelessness in October 2022 when the stock price fell below its neckline (dotted line) at $217. The plunge occurred after the Austin-based company announced it delivered a record 343,800 EVs during Q3, up from 254,700 the previous year.
According to bears, Tesla was growing quickly, yet not fast enough to support its rich valuation.
The share price plummeted further when the company announced the waiting time for new vehicles had shrunk to only a few weeks. Shares reached a low of $103 in January as Tesla cut the price of its EVs to spur demand.
There is one other aspect of technical patterns you should know: measured targets. In the case of head and shoulder tops, the target is the height of the head, less the break point level.
For Tesla, the head occurred the first week of November 2021 at $414.50. On that date, the neckline was $191.40. The height of the head is $223.10. The breakdown occurred. Subtracting the height in October 2022 at $219.70, the target is $219.70–$223.10, or minus $3.40.
The share price of Tesla is not going to decline to a negative number. In this case, I would use the first critical support level at $64.10.
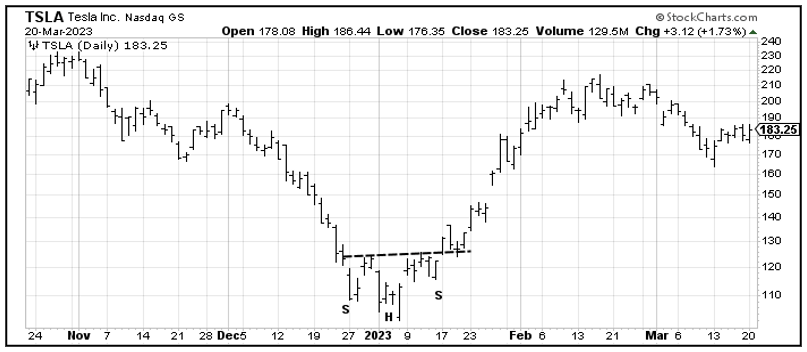
Head and Shoulders Bottom
Remember, these patterns can occur in all time frames, and they can be quite small.
A small head and shoulder bottom pattern started in December 2022 when Tesla shares fell to a low of $108.7 before rallying back to $124.48. Shares declined on Jan. 8 to a relative new low at $101.81 before once again rallying back to the $123.52 on Jan. 8. The stock dipped to $115 between Jan. 10 and Jan. 13.
The head and shoulder bottom breakout occurred on Jan. 17 when shares opened above $125. Within a month, Tesla stock pushed to a high of $216.75. The gyrations created a well-defined head and shoulder bottom pattern, often also called an inverse H&S pattern:
Click here to view full-sized image.
It is noteworthy that a bullish move occurred even as the company announced dramatic new price cuts on Jan. 12. The price began to move in the opposite direction of the prevailing news cycle.
That’s the thing about stock prices: Often, they do not reflect the prevailing perception of value.
Almost everything average investors think they know about stock prices is wrong. The best strategy for understanding price is to follow prices, not investment pundits. Learning how to read price charts and patterns is a good first step.
Thanks for reading,
Jon D. Markman
P.S. According to Weiss analyst Chris Graebe, the Silicon Valley Bank panic is already driving promising companies to equity crowdfunding, an alternative funding that allows regular, nonaccredited investors to invest in early, pre-IPO companies. This presents a huge opportunity for Weiss Members. On March 28, Chris is unveiling one such opportunity that is well-positioned to disrupt a $100 billion industry. Click here to learn more about how to claim an early stake.