 |
| By Nilus Mattive |
For many years now, I’ve been saying inflation is persistently worse than the government tells us …
That our monetary policymakers don’t have the guts — or the political motivation — to fully tamp it down …
And that price increases would almost certainly start to accelerate all over again.
You already know this in your bones, of course.
Heck, we all LIVE IT on a daily basis.
Gas, food, housing … the things we need the most grow more and more expensive ... and it’s been this way for our entire lives.
Things have been especially bad this decade, though.
Before COVID, my typical Trader Joe’s grocery bill was $120. Today, it’s closer to $200.
I just put three-quarters of a tank into my Ford Bronco the other day. Last year I was filling the tank for the same price.
Back in 2016, I was renting a four-bedroom house in my current neighborhood for $3,600 a month. A decade later, a one-bedroom guesthouse runs just as much.
So I don’t need the government to tell me what’s happening.
Yet Washington’s distortions still matter because they drive the rates on a lot of things, including Social Security cost-of-living adjustments.
The fact that politicians, government agencies, and the Federal Reserve continue to understate inflation makes everything worse.
And now, with the Strait of Hormuz still essentially closed as I write this issue, even the official inflation gauges are going to jump higher in the months ahead.
Make no mistake: The lies and distortions aren’t going to stop. They will only multiply as prices keep rising.
Indeed, we recently learned about a “one off” change at the Bureau of Economic Analysis (BEA).
This supposedly harmless change led to an artificially lowered version of the Personal Consumption Expenditures (PCE) inflation gauge.
PCE is the gauge favored by the Federal Reserve to make its policy decisions.
The BEA folks basically said they did this because data from the Consumer Price Index was too volatile (i.e., too high).
Which is funny because the CPI itself already wildly UNDERREPORTS the true inflation rate.
For example, back in 1983, Washington statisticians replaced home prices and mortgage costs with something they call “Owners’ Equivalent Rent” (OER).
Instead of just tracking actual prices, they pretend that homeowners rent their homes from themselves.
How significant was this change? Huge!
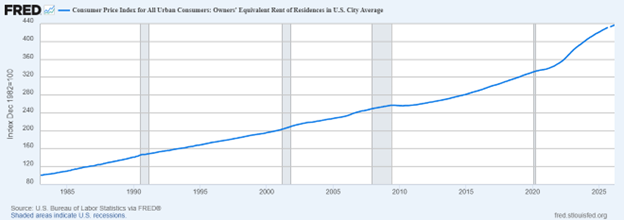
Housing represents about 34% of the CPI. That makes it the single largest component of the entire index.
Result: Actual inflation can often be significantly underestimated.
Especially during housing booms or housing shortages — when the cost of buying or owning a home goes up sharply.
Consider the years 2000 through 2006, for example …
- Based on the widely respected Case-Shiller Index, U.S. home prices rose approximately 90% during that period.
- But the Owners’ Equivalent Rent used to measure consumer price inflation rose by less than 30%.
Or what about the fact that the CPI now uses “geometric mean weighting” to account for “substitution bias?”
The basic idea there is that CPI doesn’t just track a fixed basket of goods to show us how prices are changing over time.
(Which is what any normal person would assume it does.)
Instead, it relies on the assumption that, when prices go up on goods and services, consumers replace them with cheaper goods and services.
For example, if the price of steak goes up sharply, statisticians assume consumers might buy hamburger instead.
So, to calculate the inflation rate, they start shifting to hamburger, which naturally reduces their measure of inflation.
But when a family has to downshift to a lower standard to adjust to rising costs, does that mean those costs are no longer rising as much?
Or does it simply mean that the inflation is forcing them to make unwanted adjustments in their lifestyle?
You probably have your own answer to that question.
I could keep going, but here’s the rub …
Inflation is the No. 1 monetary threat any of us faces.
It literally erodes the value of our hard-earned money year after year.
It is the very reason we have to invest in the first place.
It has continued to run hotter than they’re telling us.
And now it will only accelerate because of what has been happening in the Middle East.
So what can you do to protect yourself?
First, make sure you own a wide range of assets that can stay ahead of REAL inflation.
Those assets include high-quality stocks that pay solid dividends, precious metals and related investments, and real estate.
Second, strongly consider layering in additional strategies that can further boost the income you receive from your portfolio — especially the unique approach I’ve been recommending to a small group of Weiss Ratings readers.
I’ll explain exactly how it works in a special online event TOMORROW, May 12, at 2 p.m. Eastern time.
Simply click here to reserve your spot and join me for all the details.
As you’ll see, we’ve been using this approach to pull in roughly $1,000 almost every Friday with a win rate of 93.8%.
(And that’s based on our real, actual published trades. NOT back-testing.)
Most importantly, listen to your own common sense and experience rather than trusting any of the figures central bankers, government officials, and mainstream publications are trying to push on you.
Best wishes,
Nilus Mattive
P.S. Seriously, I really do hope you take a little time to learn about that strategy I’m going to talk about in tomorrow’s web event. It’s something that just about anyone can start using. In fact, I taught my own Dad how to do it more than a decade ago, and he had almost zero investing experience. Click here to reserve your spot to hear the whole story tomorrow.