 |
| By Karen Riccio |
Every trader has their own little cues and tools that help them identify potential price movements in stocks.
One of the simplest — and often quite accurate — tools used in the investing world are moving averages. And you don’t need a fancy acronym like CFA, CMA or CFP after your name to understand how to use them to your advantage.
Moving averages are lines plotted on a stock chart that act as filters for screening out daily noise, while still capturing much of the critical underlying price trend.
It’s a good way to quiet day-to-day stock market movements that often appear random and impossible to predict.
Instead, moving averages — 50-day and 200-day are the most common — allow us to focus on longer periods of time, when stocks exhibit patterns that reveal short-, intermediate- and long-term trends.
As the name implies, averages change, or move, on a daily basis. The end result after however many days of data is a smooth, sloping line that reflects an accurate and precise snapshot of the market’s trend.
Moving averages can slant in one of three directions: down, up or sideways. If it’s sloping downward, it’s likely that the stock or index will follow suit. If it’s gradually moving upward, it’s likely to do the opposite.

Because they help give you a picture of a clear price trend, moving averages can be especially helpful in volatile markets, like today, when it can be difficult to see the big picture.
Knowing if an individual stock, ETF or index is nearing a support or resistance level on its moving average can also help determine direction.
These two terms refer to price levels on charts that tend to act as barriers, preventing the price of an asset from getting pushed in a certain direction.
A resistance level is a price where, experience and history have shown, sellers of the stock will step in and distribute (sell) their shares.
A support level is a price where, experience and history have shown, buyers of the stock will step in and begin to accumulate (purchase) shares.

Click here to see full-sized image.
Like all technical indicators, though, they’re not 100% accurate. That’s why it’s best not to rely solely on moving averages to make investment decisions.
Instead, you should use them in conjunction with proprietary tools used by Weiss Ratings to determine the strongest stocks.
How to Calculate Moving Averages
The 50-day and 200-day moving averages are found on most stock data charts. But if you want a customized one, there’s a mathematical formula for determining the mean (the average) price of a security in any specific period.
To determine the 50-day moving average, for example, you would take the sum of the last 50 days’ worth of closing prices and divide that number by 50. To find, say, the 200-day moving average, you’d add up 200 days’ worth of prices and divide by 200.
One of the most telling signs of a potential uptrend is a “golden cross.” This happened with the S&P 500 back on Feb. 2.
A golden cross occurs when the 50-day moving average crosses above the 200-day moving average, or when the short-term average price of a stock rises above its long-term average. This formation suggests the start of an uptrend.
On the contrary, a death cross occurs when the 50-day moving average falls (or crosses) below the 200-day moving average. This means that the short-term average price of the stock is falling below its long-term average. This could signal the beginning of a downtrend.
Both formations generally precede further gains (or losses) over the following six months, or a year — but not always.
Here’s a chart of the S&P 500 showing the formation back in February.

Click here to see full-sized image.
After the close that day, the 50-day moving average for the S&P 500 stood at 3,953.61, a hair higher than the 200-day moving average, 3,951.58. This marks the first time this pattern had appeared since July 2020, according to FactSet data.
And most importantly, it did seem to signal the rally in stocks during the first part of this year.
Historically, the S&P 500 has seen 52 golden crosses since 1930, according to Dow Jones Market Data. Analysts used backtested data for the years prior to the index’s creation back in 1957.
During that period, stocks traded higher one year later 71% of the time. However, it’s important to note exceptions often happen during periods of high volatility.
The S&P 500 declined during the 12 months that followed the golden cross that occurred on April 1, 2019. We also saw declines in 1999 as the Dot-Com Bubble burst … and following a golden cross that occurred in 1986, prior to the “Black Monday” crash.
Right now, moving averages are telling us we could be in for further jolts. The S&P 500 is about to test its 200-day. And you can see the 50-day started correcting with September’s crash.
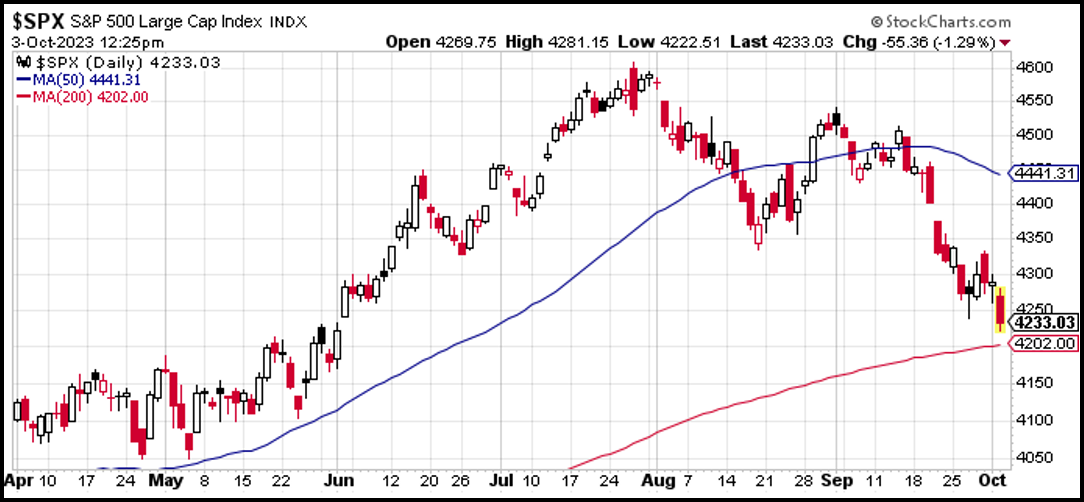
Click here to see full-sized image.
We’ll keep our eyes out for what happens next.
Knowing trendlines for any stock, ETF or index can provide guidance on where any position is headed. Should it shoot above a key moving average or skate through a resistance point, make sure you confirm it with other tools like Fibonacci Retracement, MACD or relative strength. Or you can just rely on Weiss Ratings to help you decide what to buy or sell, and when it makes the most sense to do so.
Talk soon,
Karen
P.S. Megatrend expert Sean Brodrick uses these tools all the time when pinpointing the start of a new megatrend. In fact, that’s where he is today. He recently found one and is putting the finishing touches on an urgent report. You’ll be among the first to know when all the details are ready. Keep an eye out for that.