 |
| By Gavin Magor |
Russia is selling gold it would rather keep, and China is buying gold it has no plans to sell.
That trade has run all year, and it explains the strangest thing in the market right now.
The world's most determined gold buyer just stepped up its purchases, and the price still fell.
The Contradiction
On Wednesday, the People's Bank of China (PBoC) reported that it added 740,000 ounces of gold in September.
That lifted its official holdings to 77.47 million ounces and extended its buying streak to 23 straight months.
It was also more than the 650,000 ounces it added in August.
Yet gold lost over 6% of its value in September.
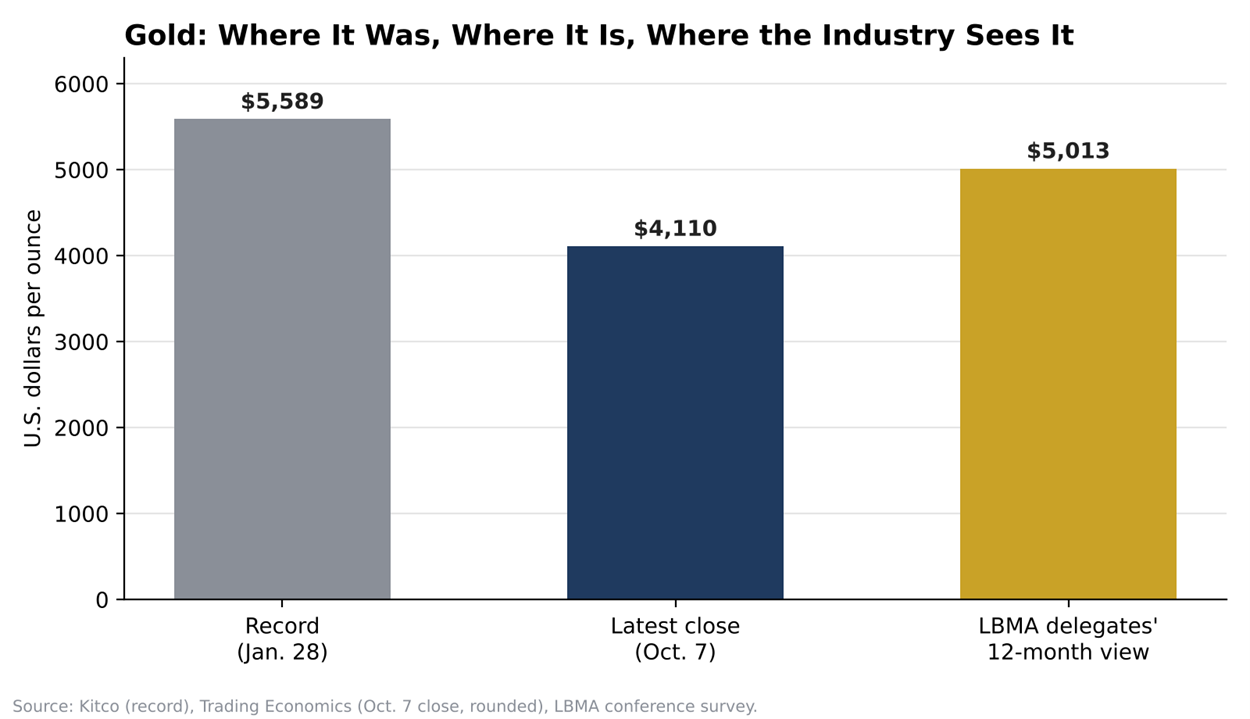
Spot gold ended Wednesday near $4,110 an ounce, more than 26% below its January spot record near $5,590.
So, how does a market fall when its biggest buyer is buying more?
Who Sets the Price
Central banks buy tonnage, not timing.
The PBoC raised its purchases as prices fell, which tells you price is not what drives its decisions.
The daily price is set by a different crowd: Western investors and traders who weigh gold against what cash and bonds pay.
The Federal Reserve raised rates in September, and the minutes released Wednesday show most officials expect another increase by year end.
With the 10-year Treasury yield near its highest level since 2002, owning an asset that pays nothing costs more than it has in decades.
Whilst that crowd sells on every hawkish headline, Beijing keeps buying.
And this year, the sellers have had extra gold to work with.
Where the Extra Gold Comes From
Russia is the world's second-largest gold producer, mining more than 300 tonnes a year.
Western sanctions have shut its bullion out of London, its main market before 2022.
So, it goes east.
Through July, Hong Kong had taken in 112.7 tonnes of Russian-origin gold this year, a record that already tops the whole of 2025.
That is almost 15% of the gold Hong Kong imported for commercial trade, and the city has long been a key doorway into mainland China.
Chinese customs data also showed direct Russian gold shipments to China rose ninefold in 2025, to 25.3 tonnes.
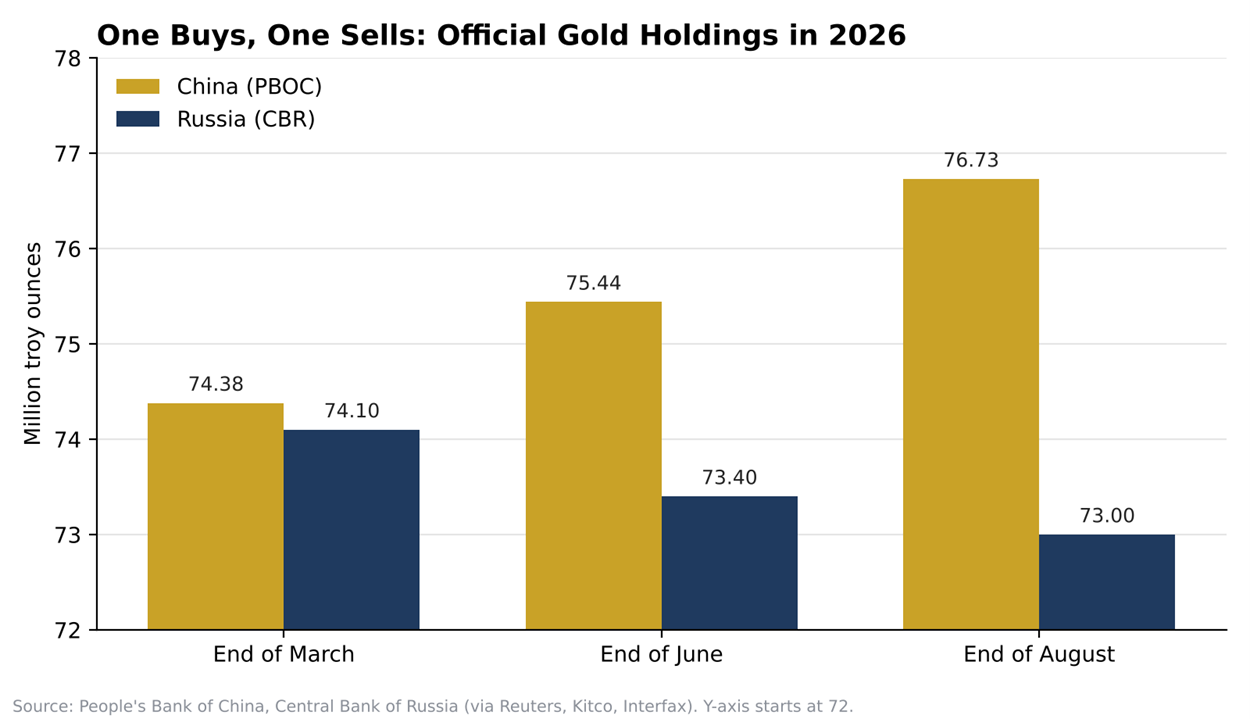
Russia's central bank is selling, too.
The Central Bank of Russia (CBR) held 73 million ounces at the start of September, down from 74.8 million at the start of the year.
That is about 56 tonnes in eight months, and Russian analysts tie the sales to funding a widening budget deficit.
Some of those transactions have reportedly exchanged gold for yuan.
Put simply, Russia is a forced seller and China is a willing buyer.
Why This Is an Opportunity
Forced selling is temporary.
Russia's gold reserves are already at their lowest level since 2020, and a central bank can only sell what it has.
The Fed's tightening has a ceiling, too. Its own minutes describe one more imminent hike, not an open-ended campaign.
When either pressure eases, the extra supply will already be sitting in Beijing's vaults.
That is when price-sensitive money tends to come back, and it will find less metal waiting for it.
In a World Gold Council (WGC) survey in June, 45% of central banks said they plan to increase their gold reserves over the next year.
Delegates at this week's London Bullion Market Association (LBMA) conference put gold at $5,013 an ounce a year from now, about 22% above yesterday's close.
For my part, I expect the gap between what central banks are willing to pay and what the market is charging to close in gold's favor within the next 12 months.
How We'd Play It
There are two ways to stand alongside China.
The first is the metal itself.
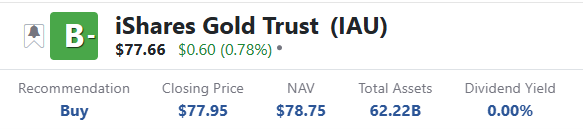
The iShares Gold Trust (IAU) holds physical gold and carries a Weiss rating of “B-,” a BUY.
It charges 0.25% a year, making it a low-cost way to own exactly what the PBoC is buying.
The fund closed Thursday at $77.66 a share.
The second is a gold miner.

Newmont (NEM), the world's largest gold producer, also carries a Weiss rating of “B-,” a BUY.
Its shares closed Wednesday at $115.55.
Its all-in sustaining cost was $1,621 an ounce last quarter.
At current gold prices, that leaves a margin of nearly $2,500 on every ounce it mines.
Newmont generated a record $2.2 billion of second-quarter free cash flow and ended June with $3.4 billion in net cash.
It has also cut its share count by about 9% since February 2024, so each remaining share owns more of that cash flow.
The stock is down about 16% from its 52-week high of $135.29 in late August, and I see that pullback as the entry point.
And unlike a lot of miners, it pays a dividend. It’s not a large yield, at about 0.9% annually, but it’s been reliable. The company has paid a dividend since 1934.
Gold itself doesn’t pay a dividend. Nor does the IAU.
Miners move more than the metal in both directions.
So, if you were looking to decide between IAU and NEM today, the iShares fund is the steadier holding and Newmont carries more leverage to a recovery.
Key Items We're Watching
- The PBoC's October reserve figure, due in early November, for a 24th-straight month of buying.
- The CBR's monthly reserve report, for any slowdown in Russia's sales.
- The Fed's Oct. 27–28 meeting, and whether officials hold to one more increase.
- Hong Kong's monthly trade data, for Russian gold flows beyond July.
- Newmont's third-quarter results on Oct. 22, for costs against its $1,680 full-year guidance.
Bottom Line
Gold is falling because the sellers in front of the market need cash, not because the buyers behind it have left.
China raised its purchases into the decline, and Russia's capacity to keep selling is shrinking.
We'd own that setup through the iShares Gold Trust for the metal and Newmont for the leverage.
Cheers!
Gavin
P.S. Both IAU and NEM currently earn BUY ratings. Want to see how your other investments stack up?
With Weiss Ratings Plus, you can access ratings on thousands of stocks and ETFs to help you spot opportunities and identify risks before you invest.