Silver Just Went on a Fire Sale — Wall Street Didn't Blink
 |
| By Sean Brodrick |
For market observers who watched silver soar to an all-time high in January to around $121 an ounce, today’s price looks like a meltdown.
The white metal trades now near $57.27, down over 52%.
But while some investors see wreckage, I see the tightest physical market I've tracked in years, marked down by half.
And I see a chance to buy a widening supply deficit at fire-sale prices before Main Street catches on again.
There's real money to be made getting ahead of what’s going on.
Let me show you what I’m talking about …
1. The Deficit Didn't Get the Memo
While the price fell, silver’s physical math didn't budge.
The Silver Institute's World Silver Survey just confirmed a sixth consecutive annual supply deficit of 46.3 million ounces, wider than last year's 40.3 million gap.
Since 2021, the world has burned through an estimated 762 million ounces of above-ground silver stocks.
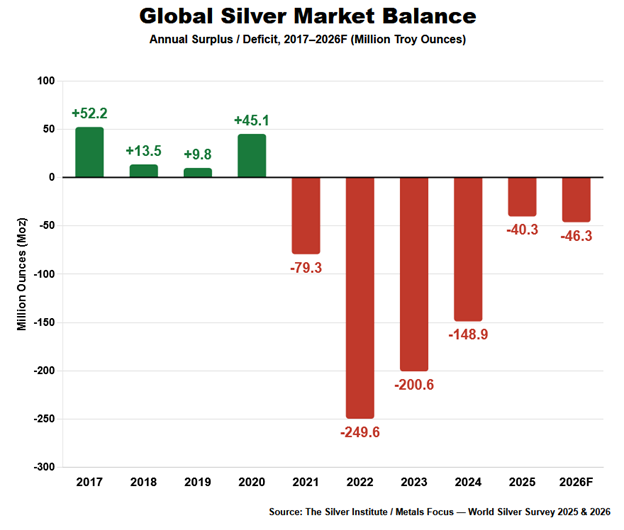
In other words, silver demand has badly outpaced what mines and recycling can produce.
Up to 60% of global silver consumption is now for industrial uses.
Silver is a critical input to solar panels, where a special silver paste is used to catch and transfer electricity.
This sector alone consumes up to 30% of all industrial silver.
An electric vehicle uses almost double the amount of silver (up to 50 grams) in the complex wiring and power sensors than a gas-powered car does.
It’s also crucial in making semiconductors, 5G networks and the AI data centers going up at an astonishing pace.
So while prices fell this year, these fundamental needs haven’t shifted.
2. Getting More Supply Isn’t Easy
Roughly 74% of the world's silver comes out of the ground as a byproduct of copper, lead and zinc mining.
That means that even when silver prices rise, miners don't jump to dig up more of it.
Their decisions run on copper grades and zinc economics. Silver is mostly an afterthought.
Only about 26% of the supply comes from primary silver mines. And a new mine takes seven to 15 years — sometimes longer — from discovery to first production.
If supply couldn't catch up at $120 an ounce, it sure won't at $57.
3. Silver Is Dirt-Cheap vs. Gold
Right now, the gold/silver ratio sits at about 69-to-1, near the top of its 50-year range. That means 69 ounces of silver will get you an ounce of gold.
As recently as May, it was 55-to-1. Translation: silver hasn't been this cheap against gold in ages.
That’s important when you consider that few silver analysts have cut their spot price targets to match the recent selloff.
The LBMA's 26-analyst consensus still calls for silver to average $79.57 this year. JPMorgan's base case is $81. Goldman Sachs sees $85 to $100 if industrial demand holds.
That's roughly 30% to 45% upside just to reach the consensus.
4. The Shortage Moved East
Physical silver in Shanghai trades at a premium of roughly 10% or more over the Western benchmark price.
That gap survived the entire 52% crash. When buyers keep paying 10% over spot for real metal all the way down, that's genuine physical tightness, not leftover hype.
Western physical buyers are stepping up, too. The Silver Institute forecasts bar and coin investment will jump 18% in 2026 to its highest level since 2022, led by a 57% rebound in U.S. demand.
So who's been selling? ETF traders, paper hands. The people who buy actual metal are loading up into the selloff, on two continents.
Could the Fed surprise with a rate hike and extend the pain? Sure. But rate decisions don't build silver mines, and the physical deficit doesn't care what Chair Warsh says.
How to Play It
One easy way to play the trend is to look at the juniors.
The Amplify Junior Silver Miners ETF (SILJ) holds 68 small- and mid-cap companies that explore for, develop or produce silver.
These are the little guys with the most profit potential when prices rise. The fund has an expense ratio of 0.69% and a dividend yield of 2.14%.
Why juniors? Leverage. When silver runs, the small producers' margins explode — and their stocks move a multiple of the metal.
Fair warning though. Miner leverage cuts both ways.
If metals leg down again, margin compression magnifies the drop. Size your position accordingly.
Let's look at the silver price chart …
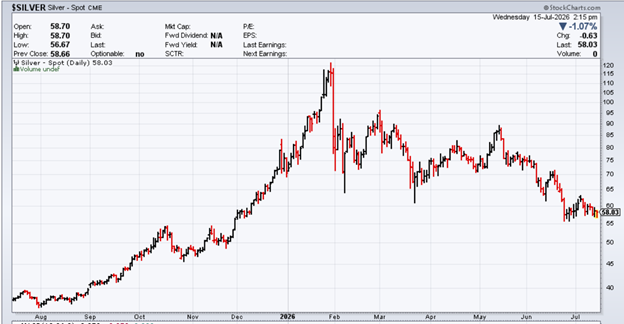
Silver held critical support at $56-$58, then bounced on the soft June CPI print which came out July 14 and was the biggest monthly decline since April 2020.
The first resistance sits at $65. Clear that, and $68 and $76 open up. The July 28-29 Fed meeting is a near-term catalyst. A hold on rates plus dovish language lights the fuse.
Bottom line: Silver’s deepening structural deficit is intact while prices are half of what they were in January.
Meanwhile, Shanghai buyers pay 10% over spot for the real thing.
That's not a silver market breaking down. That's a market on sale.
Get your piece of this bull before it really starts to run. Let's go!
All the best,
Sean
P.S. This is just one of the trends and discounted markets I’m watching right now.
Another, after the recent sell-off, is space stocks. No, not SpaceX. I have other, better ways to play this inevitable boom.
I’ll share all my research on Tuesday at a special event. Here’s your ticket.