The 2 Most Important Charts in Precious Metals Right Now
 |
| By Sean Brodrick |
Everyone's out there chasing the latest meme stock or meme coin.
Meanwhile, two charts are screaming one message so loud it's deafening …
Precious metals are poised to go ballistic.
What's happening right now in these markets is the financial equivalent of watching a dam about to burst.
Yet, and most investors are standing downstream, completely oblivious.
First, we all know central banks are buying gold, right?
Well, no matter how much you think they’re buying, they’re buying even more!
“Central banks have emerged as a driving force behind the record-breaking bull market for gold, and while the true scale of their buying is shrouded in mystery, nobody expects them to stop.
“Globally, they are accumulating roughly 80 metric tons of gold a month, worth about $8.5 billion at current prices, analysts at Goldman Sachs estimate.
“Most of the buying is secret, although trade data indicates China accounts for a lot of the purchases, along with other unidentified buyers via Switzerland.”
Pretty wild!
Here’s a chart showing how much in gold purchases central banks are declaring … and how much they’re REALLY buying.
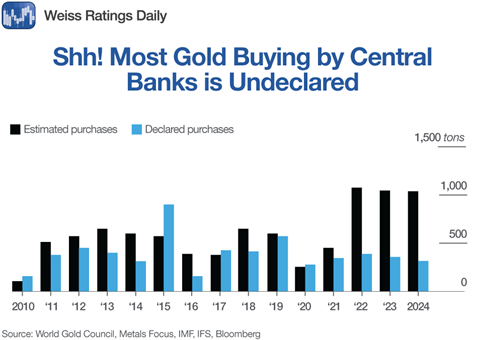
Holy crap-ton of gold!
And the buying continues …
China’s central bank announced on Saturday that it had added another two metric tonnes of gold to its reserves in May.
That’s the seventh month in a row of official gold buying for China.
And as that chart shows, central banks of countries like China are snapping up a lot more gold than they’re letting on.
Why? Because America uses its currency like a cudgel to punish its enemies, that’s why.
Central banks started buying gold hand over fist after the U.S. froze Russia’s foreign exchange reserves in 2022, following that country’s invasion of Ukraine.
That event caused gold to shine.
It’s free from direct links to the economic policies of any country, can’t be frozen electronically, is resistant to crises and has historically maintained its value.
This secret — and not-so-secret— buying by central banks points to much higher prices for gold in the longer term.
There’s one other thing that points to higher prices for gold.
I’m talking about silver!
Gold’s little sister just smashed through a major overhead resistance level.
Last week, it surged to its highest weekly close in 13 years. That is a powerful technical breakout.
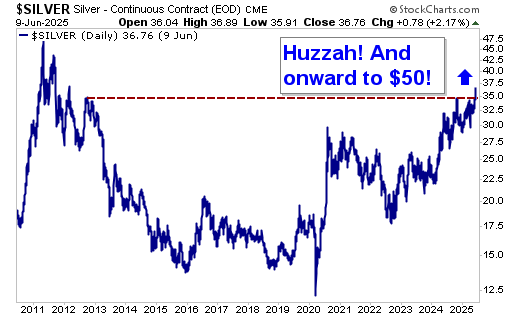
Look at that!
I expect a short-term pullback in silver, which will be a great time to load up if you’re not already long.
That said, there’s little resistance between recent prices around $36-$37 and the 2011 high around $50.
Could silver go much higher from there? Bank on it!
Here’s a fun historical fact: In the early stages of a precious metals bull market, gold leads silver. We saw that happen last year.
However, when precious metals bull markets truly take off, silver significantly outperforms gold.
The historical record is pretty stunning:
- 1970s bull market: Gold surged 2,300% while silver exploded 3,540%.
- 2000s bull market: Gold gained 648% while silver still outperformed with 1,106%.
Gold put in a big bottom most recently in September 2023 at $1,809.50.
For reasons I’ve explained before, my target for gold is $6,900.
That’s a rise of 281.45% from where gold started this bull market. And more than 107% from its current level around $3,323.
Sure, I might be too conservative in my projections. But it’s a place to start.
History shows us that as a precious metals bull market plays out, silver outperforms gold on the upside. A LOT!
So, could we see $100 silver?
Absolutely!
Silver is coiled tighter than a loaded spring. My research tells me it’s ready to unleash an explosive move …
The kind that creates millionaires in a matter of months.
The kind that leaves traditional asset managers scrambling to explain to their clients why they missed the most obvious setup in decades.
These aren't random price spikes …
These are the cycles I’ve talked about for years.
And they’re compounded by a looming breakdown of a global financial order staggering under the weight of overwhelming sovereign debt.
The central banks can see it coming. That’s another reason why they’re buying gold hand over fist. (And, seemingly, behind our backs.)
The smart money has been quietly positioning, too.
Meanwhile, retail investors who don’t read this column chase digital assets and pray for a Fed pivot.
Good luck with that, Charlie.
How You Can Play It
There’s an easy way to play the coming surge.
I’m talking about the iShares Silver Trust (SLV).
It has an expense ratio of 0.5%, and it holds physical silver.
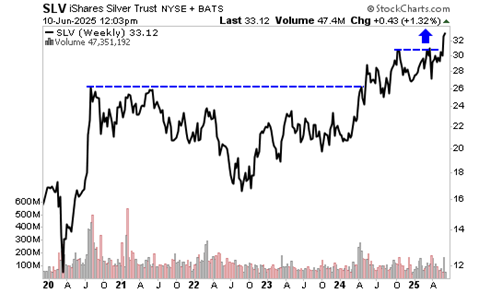
Like silver, the SLV is breaking out.
Yeah, you can wish you bought it five years ago, when it was at $12.
Even if you didn’t, the real question is, will you buy now, before silver really takes off?
The question isn't whether gold and silver will surge higher.
The question is whether you'll be holding them when they do.
All the best,
Sean
P.S. And I can help with that.
I recently sat down with Chris Hurt to show readers how to 1,000x their gold profits — WITHOUT buying another ounce.
Watch the whole interview here.
And follow the instructions at the end of that video conversation to see exactly how you could do that, too.