 |
| By Gavin Magor |
Although the immense profit potential of the stock market has been around for centuries, many investors may not realize that exchange-traded funds, or ETFs, are a relatively newer market phenomenon.
The first ever ETF to trade in the U.S. was the SPDR 500 ETF Trust, which launched in 1993.
I am a big proponent of ETFs. And I really think investors should be using them to their advantage.
The profit potential is big, and they offer a wide array of benefits.
It’s a major reason why we here at Weiss Ratings have an entire database full of 2,939 ETF ratings.
There is no better place to help you do ETF research than with the Weiss Ratings at your side.
Elite Trading with a Weiss Rating
ETFs give investors easy diversification and exposure to a wide array of stocks, bonds, commodities and real estate that would, for all practical purposes, be impossible.
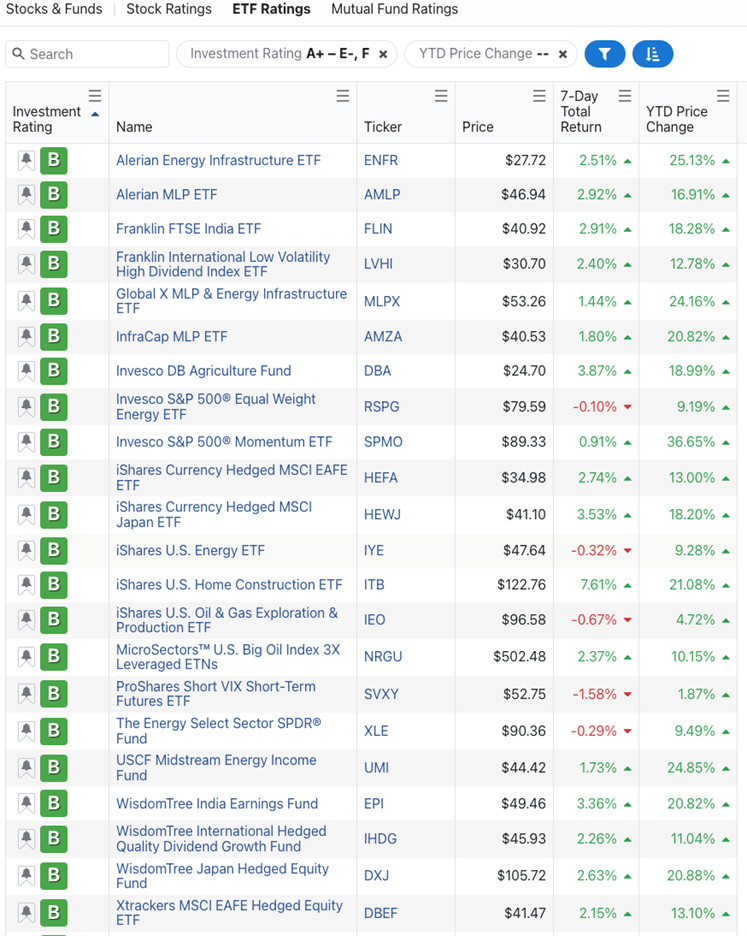
Currently, we have 22 ETFs within our “B” range, and none rated higher. Let’s take a look at those:

You can see that I included year-to-date performance of the funds. Currently, all are up. And some are even up as much as 25% and 37%.
You may be asking yourself how does an ETF rating differ from a stock rating?
Here is how we define a “B” ETF rating:
“The fund has a good track record for balancing performance with risk. Compared to other funds, it has achieved above-average returns given the level of risk in its underlying investments. While the risk-adjusted performance of any fund is subject to change, we believe that this fund has proven to be a good investment in the recent past.”
Let’s look at one that fits this definition perfectly — Invesco S&P 500 Momentum ETF (SPMO).

The ETF is ultimately designed to track the investment results of the S&P 500 Momentum Index. That index tracks the performance of the top 100 stocks in the S&P 500 that have performed well.
In the image above, you can get a really in-depth conceptual overview of the major components of the fund.
We can see important aspects like dividend yield, expense ratio, total assets and more.
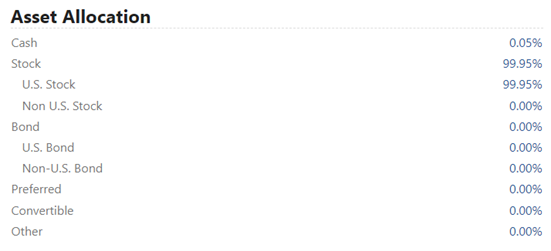
Down the page, you can see its asset allocation:

In this ETF example, we can see that it is comprised of nearly all stocks.
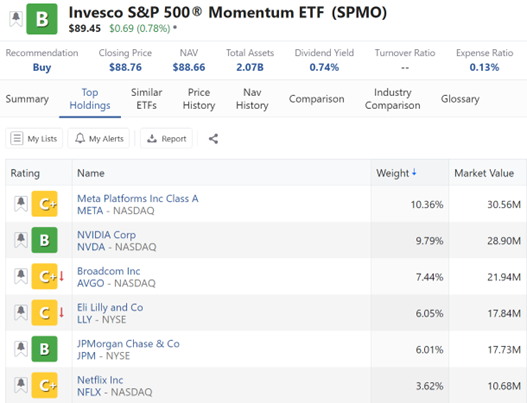
Another important aspect of deciding whether this ETF is right for your portfolio is with the “Top Holdings” tab:

In this ETF, we can see that Meta (META) — formerly Facebook — is the top component with a $30 million market value. That’s followed by Nvidia (NVDA).
Since this ETF mimics strong momentum, it’s not surprising to see these two stocks, which have had strong years in terms of stock performance.
So, if you’re considering doing ETF research, please take a visit to our ETF screener page.
Cheers!
Gavin Magor

