
 |
| By Sean Brodrick |
The fragile ceasefire between the United States and Iran collapsed over the weekend.
Iran resumed missile and drone attacks, and the U.S. responded with another wave of massive airstrikes.
We've been here before. And we know what comes next: a new peace deal.
That next peace deal is your opportunity to buy an ETF for higher-for-longer oil prices.
Why? Because President Trump has repeatedly said a deal with Iran was “imminent,” “close” or “just around the corner” at least 38 times — according to CNN’s tally — only to watch negotiations unravel days later.1
Odds are we'll hear another peace announcement before long.
When that happens, oil stocks will pull back … again.
But not for long.
My view has long been that this conflict is likely to last much longer than the market thinks possible.
Even temporary ceasefires won't erase the damage that's already been done to global energy markets.
The longer this conflict drags on, the more the world's oil trade will be permanently rewired.
Countries aren’t going to wait on diplomacy.
They find new suppliers, sign long-term contracts, build new infrastructure and reduce dependence on unstable regions.
That creates a multi-year opportunity for North American energy producers.
Here are three reasons why.
1. North America Is Safely Outside the Blast Zone
The biggest competitive advantage isn't bigger reserves or better technology. It's geography.
North American producers operate entirely outside the Middle East conflict zone.
Their pipelines, refineries and production facilities are protected by one of the safest security umbrellas in the world.
Their supply chains are domestic.
Their infrastructure isn't dependent on vulnerable shipping lanes or chokepoints thousands of miles away.
That kind of stability commands a premium during periods of geopolitical uncertainty.
Global investors increasingly want energy exposure without geopolitical headaches, and North America offers exactly that.
2. America Is the New OPEC
The U.S. isn't simply producing more oil. It's exporting more than ever.
For the week ending July 3, U.S. crude production reached a record 13.86 million barrels per day, and government forecasts point to even higher output next year.
Exports have surged alongside production. Crude exports recently reached an all-time monthly high of roughly 5.6 million barrels per day.
Including refined petroleum products, total energy exports now exceed 13 million barrels per day.
3. Higher Oil Prices Flow Straight to the Bottom Line
This isn't the shale industry of a decade ago.
Today's producers are lean, disciplined and extraordinarily profitable.
Large North American operators generally need West Texas Intermediate crude prices of only about $32 per barrel to cover operating costs on existing wells.
Smaller independent producers average roughly $46 per barrel.
With oil trading between $70 and $80 per barrel recently, many producers are generating enormous free cash flow.
Every additional dollar in oil prices largely falls to the bottom line.
That gives companies more cash to raise dividends, repurchase shares, reduce debt and invest in additional production.
One ETF Captures the Entire Opportunity
Rather than trying to pick individual winners, investors can own the entire domestic energy story through the SPDR S&P Oil & Gas Exploration & Production ETF (XOP).
Despite its name, XOP owns a diversified basket of companies across the domestic energy value chain:
- 65% oil & gas upstream production,
- 27.4% oil & gas refining and marketing, and
- 7.2% integrated oil & gas.
More importantly, it uses a modified equal-weight structure.
That sets it apart from traditional energy ETFs such as XLE that are dominated by mega-cap companies like Exxon Mobil (XOM).
XOP spreads its assets much more evenly across dozens of companies, giving greater exposure to small and mid-sized producers that have far more operating leverage to rising crude prices.
Many of these companies focus almost entirely on domestic basins such as the Permian, Eagle Ford and Haynesville.
They're largely insulated from overseas political risk while enjoying all the upside from stronger oil prices.
In other words, XOP is built around the idea that North America will become an increasingly important supplier to an energy-hungry world.
XOP has an expense ratio of 0.35% and a dividend yield of 1.96%.
Let’s look at the daily chart …
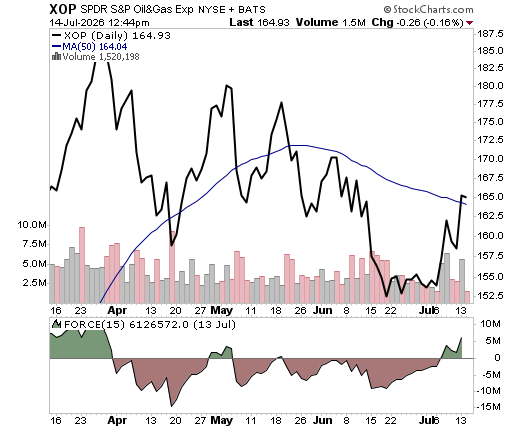
You can see that the XOP is powering up.
It just pushed above the 50-day moving average, which I consider the dividing line between intermediate bullishness and bearishness.
My favorite momentum indicator, the Force Index, is in the green. Let’s go!
Bottom line: I’m not worried about the headlines. I know the oil story is higher for longer. And the XOP is a great way to play it.
All the best,
Sean
P.S. I just identified another major trend that will soon turn into a booming rally.
I’m putting together an event to explain it all.
As a Weiss reader, you can see it live on Tuesday, July 21, at 2 p.m. Eastern.
1https://www.cnn.com/2026/06/09/politics/times-trump-iran-deal-close