This Key Metric Will Save You from a Dividend Disaster
 |
| By Jim Nelson |
Yesterday, Nilus showed you the power of dividend growth stocks.
These companies are amazing.
You load them in your portfolio.
They pay you an increasing cash flow over time.
And the share price will tend to increase to match those higher payouts.
Unfortunately, not all dividend stocks are in the same boat.
Some can be risky. And instead of raising their dividends, they sometimes end up having to cut their payout.
Since many investors buy dividend stocks for the income, even the threat of a dividend cut can send shares down as investors cash out for greener pastures.
There’s one quick way to easily weed out the riskier dividend stocks from the safer ones.
How? By looking at a company’s payout ratio.
How the Payout Ratio Keeps You Safe
The payout ratio looks at the total annual dividend per share, divided by a company’s 12-month trailing earnings.
For instance, if a company paid out $1 per share in the past year and earned $2 per share, it has a payout ratio of 50%.
That means the company took half its earnings and gave them to its owners, the shareholders.
The company retained the other half to reinvest in the business … and hopefully use that capital to further grow the business.
A company with no dividend has a payout ratio of zero percent. But some companies can have a payout ratio over 100%.
How is this possible?
If a company has poor earnings for a quarter or two, it may have to dip into the cash on its balance sheet.
But that can’t last forever.
Even if a company raises debt to continue paying a dividend, it eventually has to be covered at some point.
Companies with high payout ratios near 100% have little room to maneuver in a challenging market or during a recession when profits slide.
There are exceptions like REITs, BDCs and MLPs.
These pay out most of their income because they get tax breaks and don’t need large reinvestments back into their businesses.
Most companies, however, don’t have that luxury. Let’s look at one …
Something’s Brewing with
This Coffee Giant’s Dividend
Over the past 12 months, Starbucks (SBUX) has paid out $2.48 per share in dividends, for a 2.6% yield.
That’s not the highest dividend yield today, but it’s better than many companies.
However, that dividend is at risk.
Same-store sales in the U.S. have been stagnant for years.
Rising costs have also impacted the bottom line, reducing profit margins.
Starbucks has earned just $1.20 per share over the past 12 months.
That means that Starbucks has a payout ratio of over 200%!
Either earnings need to more than double — a challenge for a $110 billion behemoth — or, what looks more likely, is that the dividend will be cut.
Since the company started its dividend policy in 2010, the payout has soared over 1,000%.
Yet some analysts expect a dividend cut this year.
This could be fast approaching. Despite that longer-term dividend growth, it barely raised its payment this last time.
That gives it a medium payability score and low growth score on our brand-new Dividend Power Score system.
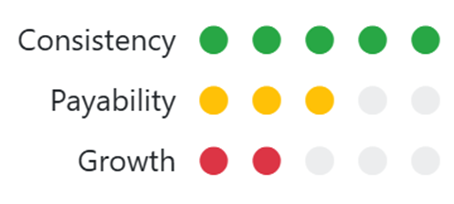
Since it hasn’t YET been cut, it still gets a solid consistency score — the third major input into our Dividend Power Score.
But don’t expect that to last!
Even if you can’t — or don’t — want to get through your day without your Starbucks fix, it’s not a buy for its dividend payment.
And that’s a clear reason why looking at a company’s payout ratio can avoid a headache and big market loss before it happens.
Starbucks isn’t alone.
There are plenty of other companies with high dividend payouts in excess of their earnings.
Those dividends are at risk.
Investing in them could mean lower income in the future, not higher income.
It could even mean no income if the company has to eliminate its dividends completely.
That’s why the payout ratio matters. And why checking the payout ratios in your portfolio holdings is critical.
But it’s only one measure and a reason why we’ve invested the time, effort and energy into creating the Dividend Power Score.
Learn more about this brand-new system here.
Sincerely,
Jim Nelson