 |
| By Sean Brodrick |
Stocks and commodities sold off going into Tuesday’s rate policy announcement by the Fed’s Open Market Committee. But gold showed surprising strength.
Today, I’m going to show you one gold chart you should be watching in the short term … and what you should buy if this chart gives the right signal.
I say gold’s strength on Tuesday was surprising, because an outlook for higher rates boosts the U.S. dollar. And since gold is priced in dollars, it tends to go down when the dollar goes up.
The majority of traders was betting that the Fed would deliver a “hawkish hold.” That means the Fed would hold rates steady, but hints that more rate hikes are to come.
And yet, gold shows that stubborn strength. I can think of a few fundamental reasons why …
Crisis Looms in D.C.
The U.S. government will shut down at the end of the month unless Congress can strike a budget deal in the next 10 days.
Republicans have refused to raise the statutory debt limit unless President Biden accepts deep cuts in federal spending. Why that matters: The last significant federal government shutdown cost the economy $11 billion. And speaking of money …
Debt Soars
The U.S. National Debt just whooshed past the $33 trillion mark.
You think that’s bad? Hold on to your hat. The debt is on track to top $50 trillion by the end of the decade, even after newly passed spending cuts are taken into account. A big reason is the fact that the Fed has yanked interest rates higher and higher, so the interest paid on the debt gets more onerous.
But not all the forces powering gold are due to the Fed and the debt.
Central Banks Are Rushing into Gold!
Data from August shows that central banks are rushing to buy gold at a rate not seen since the tumultuous 1960s.
Central banks now account for a third of all gold purchases. Here’s a chart showing annual gold purchases by central banks …
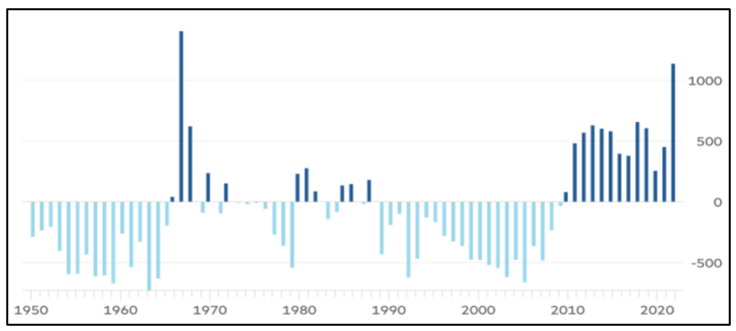
Click here to see full-sized image.
According to the World Gold Council, gold purchases rose 152% year over year to a record 1,136 metric tonnes in 2022.
This buying frenzy is continuing this year. In fact, Q1 data for this year recently came in, and it was the highest Q1 ever — up 34% year over year to 228 metric tons. That’s a new record.
Why? Many of the central banks doing the buying are in countries at odds with the U.S. They are sick of Uncle Sam’s boot on their necks — a boot that is enforced with U.S. dollars.
The One Chart to Watch
But that’s not the chart you should watch. You should watch this chart of the daily price action in gold …
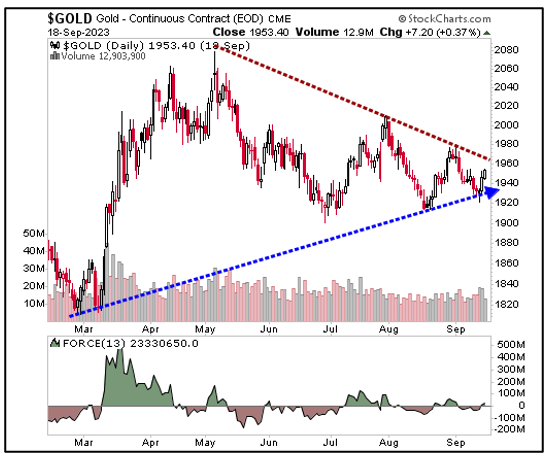
Click here to see full-sized image.
You can see that gold has been coiling up for months. It will break out of this triangle one way or another. On the bottom of the chart, I’ve put my favorite momentum indicator, the Force Index. It recently turned bullish. We’ve seen those signals before. I won’t act on it until I see gold decisively break that downtrend.
To be clear: I am not currently bullish on gold in the short term (though I am very bullish longer term). We need gold to break out to the upside on this chart before I do turn bullish.
But that could happen very soon. Perhaps in the next couple weeks. If it does happen, what should you buy?
The easiest way to play a move in gold is the SPDR Gold Shares (GLD). It’s an ETF that holds physical gold, so it tracks the price of the metal pretty well. It has a “C+” rating from Weiss Ratings, and an expense ratio of 0.40%.
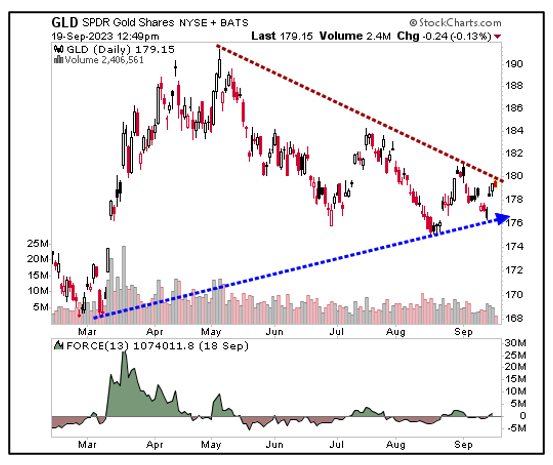
Click here to see full-sized image.
It’s no surprise that the GLD is coiling up like the metal it tracks. The breakout could come soon. Be ready to act fast.
When gold takes off, it zooms!
All the best,
Sean
P.S. Gold isn’t the only thing about to make a major move. In fact, something much larger is coming to a head. Click here to see my latest presentation on this enormous shift.