Black Monday at 39: Why CBOE Gets Paid When Markets Panic
 |
| By Gavin Magor Reviewed by: Leo Tavolaro |
If you owned stocks 39 years ago today, you lost a fifth of that money before supper.
On Oct. 19, 1987, the Dow Jones Industrial Average (DJIA) fell 22.61% and the S&P 500 fell 20.47% in a single session.
This weekend, "Black Monday" trended on social media again, after the worst week for the Nasdaq and the S&P 500 since June.
I don't think you're about to relive 1987.
But last week did tell you two useful things.
Your index fund is far more lopsided than its name suggests.
And a small group of companies quietly collects a fee every time the rest of us get nervous.
So here's the plan: what last week really showed you, why a 1987 replay is unlikely, and the stock I'd buy to get paid for the market's mood swings.
What a Bad Week Looks Like From Your Couch
Most S&P 500 money sits in index mutual funds and exchange-traded funds (ETFs).
If you own one, you probably think you own 500 companies in roughly fair shares.
You don't.
In holdings data for Oct. 12, the 10 largest positions in the iShares Core S&P 500 ETF (IVV) made up 38.95% of the fund.
That's about $3,895 of every $10,000 you put in.
The top three alone, Nvidia (NVDA), Apple (AAPL) and Microsoft (MSFT), passed 21% of the index this month, the highest three-stock share on record.
The prior record, 13.4%, was set in the mid-1980s.
In other words, the index is more top-heavy today than it was in the year of Black Monday.
When the S&P 500 closed at a record 7,818.93 on Oct. 6, fewer than a third of its stocks were trading above their own 50-day averages.
That's a rally carried on very few shoulders.
And when those shoulders belong to artificial intelligence (AI) chipmakers, a bad week for chips becomes a bad week for your retirement account.
Last Week, By The Numbers
The Philadelphia Semiconductor Index (SOX) fell 11.41% last week, and the Nasdaq Composite lost 4.48%.
The S&P 500 fell 1.95%.
It closed Friday at 7,659.44, about 2% below its record.
The trigger was worry that higher interest rates will make the costly AI building boom harder to pay for.
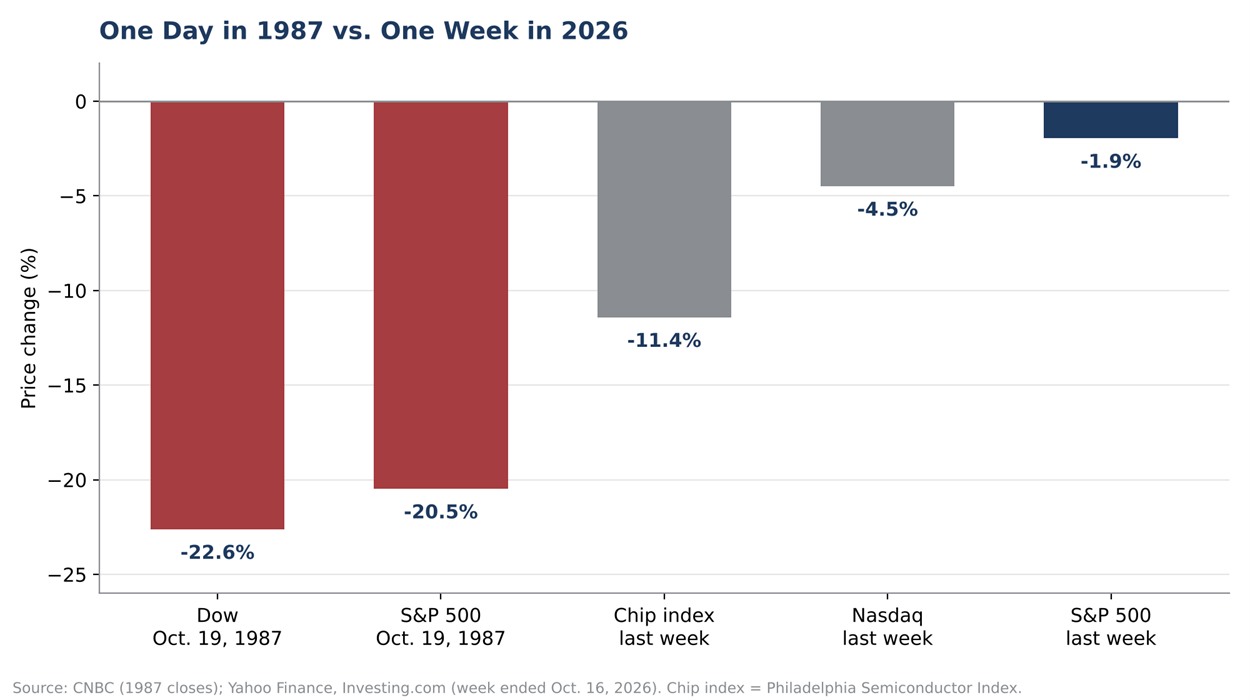
Put the two side by side and the difference is plain.
The S&P 500 lost less last week than one-tenth of what it lost in one day in 1987.
Why 1987 is a Poor Template
In the week before Black Monday, the S&P 500 had already fallen 9%.
Last week it fell less than 2%.
In 1987, there was also no button to stop the slide.
Circuit breakers came afterward.
The 15-Minute Timeout
Since 2012, the market-wide circuit breakers have been keyed to the S&P 500.
A 7% drop from the prior close halts all U.S. stock trading for 15 minutes, and so does a 13% drop, as long as either comes by 3:25 p.m. Eastern.
A 20% drop shuts the market for the rest of the day.
From Friday's close, the first timeout would arrive at about 7,123.
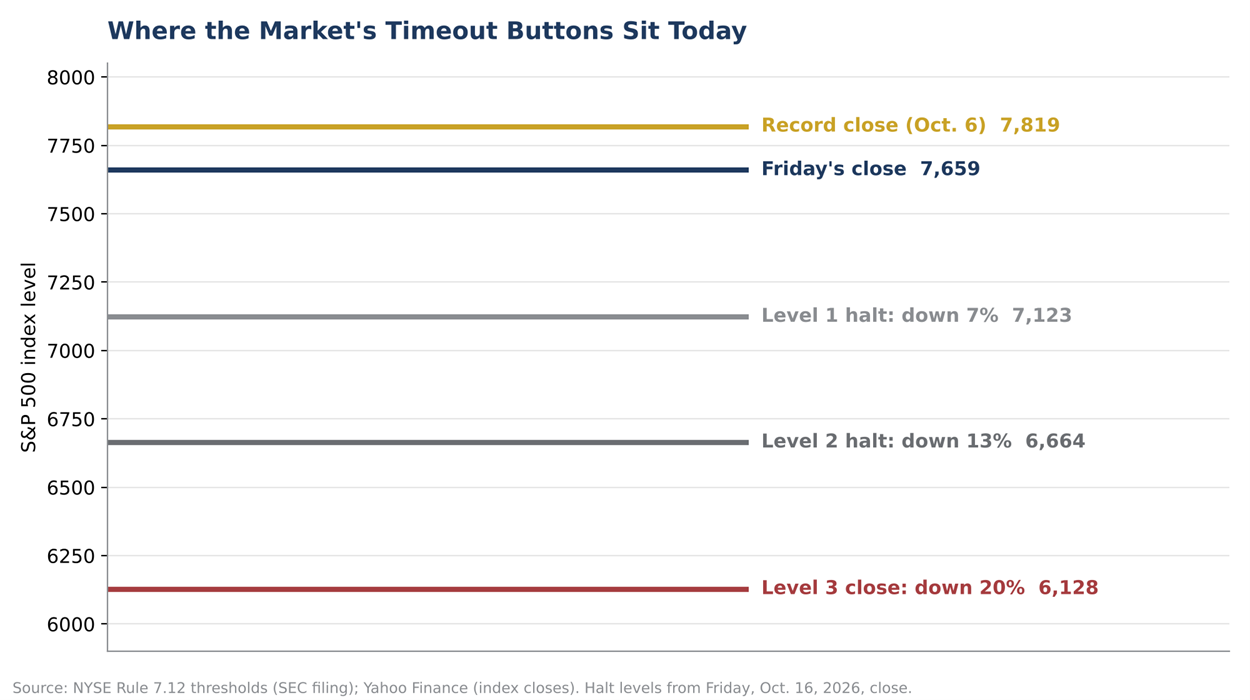
Those halts don't prevent losses.
What they do is interrupt the panic, which is exactly what was missing in 1987.
The Fear Gauge Was Born After the Crash
Six years after Black Monday, the Chicago Board Options Exchange (CBOE) launched what is now the Cboe Volatility Index (VIX), the market's best-known fear gauge.
It closed Friday at 19.99, its highest close since July 29.
That's nervous, not panicked.
Remember that gauge, because it comes back at the end of this report.
Who Gets Paid When You Panic
Every share traded, every option bought as insurance and every futures hedge passes through an exchange.
When fear rises, so does trading.
And exchanges take a small cut of every trade.
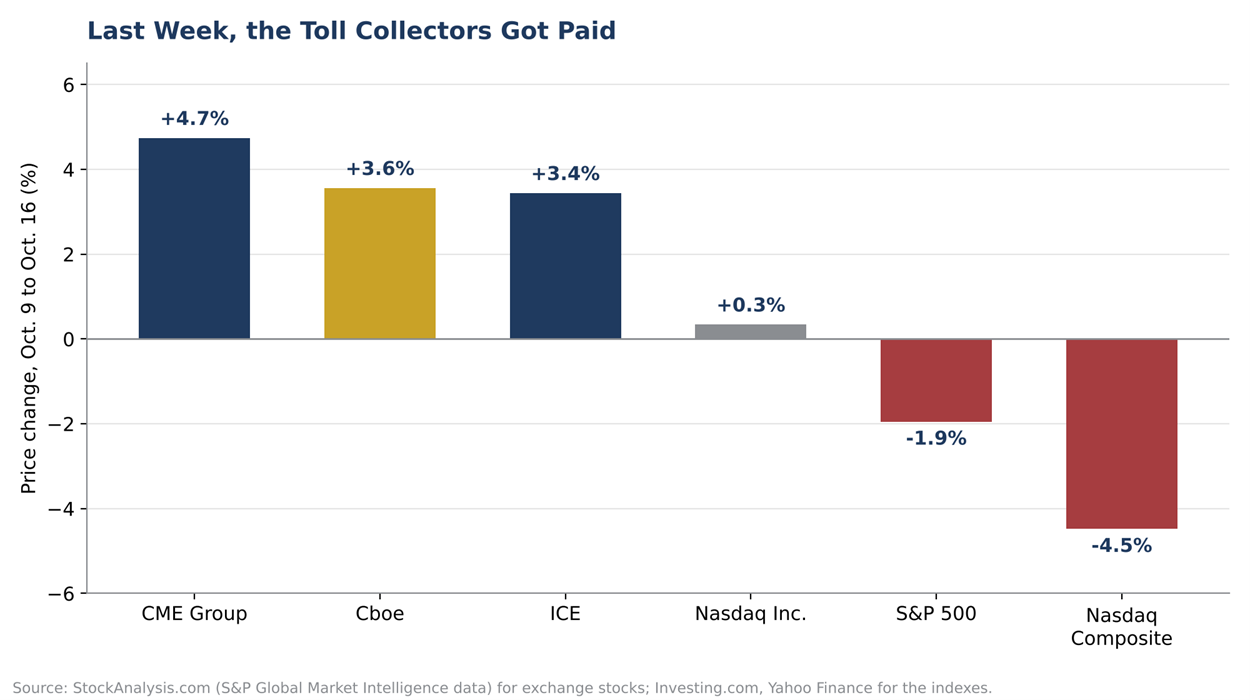
Last week, while the S&P 500 fell 1.95%, all four exchange operators in this report rose.
CME Group: The Income Version
CME Group (CME) carries a Weiss rating of B-, a BUY.
Its third-quarter average daily volume was 29.4 million contracts, up 16% from a year ago and a record for any third quarter.
September set its own record, at 31.8 million contracts a day.
Over the last 12 months it paid $11.30 a share in dividends, a 3.85% yield at Friday's close of $293.87.
Its beta of 0.08 means it barely moves with the broader market.
I'd buy it for income with a side of calm.
Intercontinental Exchange: The Owner of the Floor
Intercontinental Exchange (ICE) carries a Weiss rating of B-, a BUY.
It owns the New York Stock Exchange (NYSE), where the 1987 crash played out.
Its total average daily volume in September was up 51% from a year earlier.
Interest rate contracts led the way, up 95%, while energy rose 26%.
It's a solid holding, and I'd keep it.
Nasdaq Inc.: A Good Business, the Wrong Tool
Nasdaq Inc. (NDAQ) carries a Weiss rating of B, a BUY.
But much of its business is software, data and listings, and its beta of 0.86 shows it tends to move with the market.
It gained just 0.34% last week.
Fine to own, but not the hedge you're looking for.
The Invesco S&P 500 Equal Weight ETF (RSP) carries a Weiss rating of C+, a HOLD.
It tracks the same 500 companies, but in equal slices, so no single chipmaker can drag down your whole account.
It costs 0.20% a year.
If most of your stock money sits in a regular S&P 500 fund, moving a portion here is the simplest way I know to spread the load.
Let the Ratings Watch the Floor for You
Last week sorted stocks fast: who gets paid when markets wobble, and who gets marked down.
Weiss Ratings Plus does that sorting every day, with real-time ratings, instant alerts and exclusive analysis.
When a rating moves on a name you own, you'll know before the crowd does.
Click here to see what Weiss Ratings Plus can do for you.
Back to the Fear Gauge
Remember the gauge born after the crash?
The company that created it still runs it.
Cboe Global Markets (CBOE) carries a Weiss rating of B, a BUY.
That ties it with Nasdaq Inc. for the best rating among the exchanges in this report.
But unlike Nasdaq Inc., CBOE makes its living from the very thing you're worried about.
Its proprietary index options averaged 6.4 million contracts a day in September, up 22.3% from a year earlier and the second highest month on record.
Options on the S&P 500 that expire the same day they trade set records for both the month and the quarter.
Those are the contracts traders use for short-term bets and hedges, and CBOE collects a fee on every one.
It projects average net revenue of about 95 cents on each index options contract for the third quarter.
Its beta is effectively zero, so it doesn't sink with the market.
Through Friday, its total return this year was 27.15%.
It closed Friday at $314.98, up 3.56% for the week.
And it still sits about 15% below its May high of $371.18, so this isn't buying at the top.
If volatility cools, volume will ease, but CBOE set those records in a quarter without a crash.
How I'd Play It
We recommend buying CBOE Global Markets at market.
Think of it as portfolio insurance that pays you a dividend instead of charging you a premium.
If you want more income, pair it with CME Group.
What I'm Watching
- Oct. 21: Meta Platforms (META) and Tesla (TSLA) report after the close, the next big test for the AI trade that sank last week.
- Oct. 30: CBOE reports third-quarter results before the open, the first look at what September's records did for earnings.
- About 7,123 on the S&P 500: the first circuit breaker level from Friday's close, a line I don't expect to see but the one that matters.
- The top three's share of the index: if it keeps climbing past 21%, the case for the equal-weight fund gets stronger.
Bottom Line
Thirty-nine years ago, investors lost a fifth of their stock money in a day because nothing stopped the fall.
Today the market has a timeout button and a fear gauge, and your bigger risk is how much of your index fund rides on three stocks.
Buy CBOE Global Markets, own CME Group and Intercontinental Exchange, and hold Nasdaq Inc. and the equal-weight fund.
If the panic comes, you'll want to own the company selling the insurance, not just the policy.
And nobody has to lose a fifth of anything before supper.
Cheers!
Gavin