Thunderstruck! That's the word to describe traders on Tuesday, after the Consumer Price Index came in hotter than expected and the markets took a dive in response.
Traders spent the week leading up to the release of the CPI, telling themselves that it was going to come in low. After all, as I pointed out a week ago, energy prices are sliding.
And there were plenty of indications that used car prices were falling, too. In those last couple days before the announcement, traders talked themselves into thinking the CPI would have a seven-handle, down from earlier estimates of 8.5%.
Instead, soaring consumer staples costs pushed headline CPI to 8.26%. Ouch! Headline CPI disregards the more volatile inflation facing food and energy.
Traders jumped to the logical conclusion that the Federal Reserve will keep hiking rates higher for longer. That raises the odds of a Fed-induced recession, and more importantly, threatens the supply of the easy money that the market has come to depend on.
I could write a lot more about this, but plenty of people already have and I'd rather talk about the solution rather than harp on the problem. In fact, the question folks should be asking themselves is, "Where should I invest in this crazy market?"
Let's find out …
Looking for Returns in All the Wrong Places
Let's start with how the major S&P sectors performed on Tuesday, when CPI came out. The bad news sent the S&P 500 careening into its largest one-day decline in two years, slumping 4.3%.
Nearly all stocks went down. As my old friend Charlie said, "When the paddy wagon comes along, it takes the good girls downtown along with the bad." But you can see in the chart below that some sectors held up better than others.
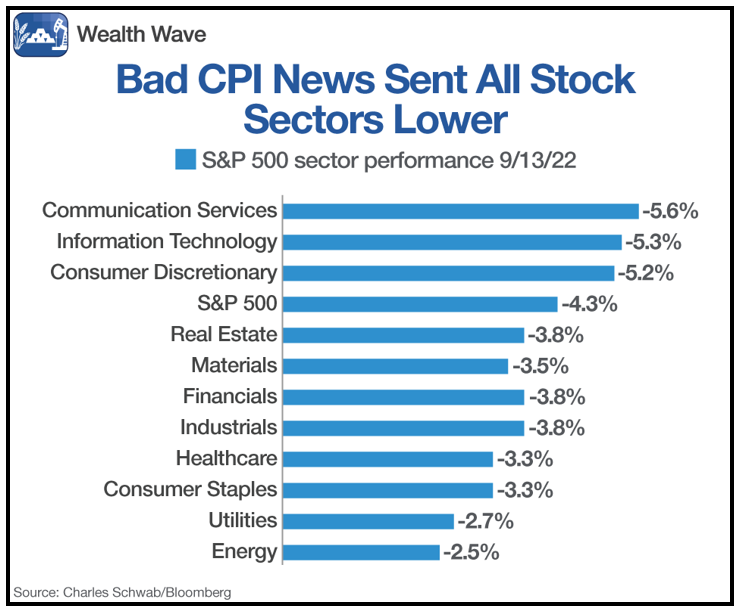
Of all the sectors, energy held up the best, with a 2.5% loss on the day, compared to 4.3% for the S&P 500.
Why? I can think of a few reasons:
1. Energy prices are high: In fact, oil prices are stubbornly high despite the fact that President Biden is releasing 180 million barrels of crude from the Strategic Petroleum Reserve. This is partly due to interruption of global oil markets as the world slapped sanctions on oil-producer Russia over its invasion of Ukraine.
2. Consumer demand for oil remains strong: The latest figures, from July, show that the amount of retail gasoline sold rose about 3.6% from the beginning of the month to the end of it. That's in line with figures from GasBuddy, which models sales from 150,000 stations and saw consumer demand hit a year-to-date high in the week ending on July 24.
3. Record profits mean fat dividends: Big Oil's raking in their highest level of profits in over seven years. Up and down the oil patch, company coffers are stuffed with cash. That means more money to return to shareholders through dividends and stock buybacks.
I believe rising, fat dividends are the key to why oil stocks have outperformed the S&P 500 since bottoming in July.
One quick note: If you're interested in my individual company picks in the energy sector, consider joining my trading service, Wealth Megatrends. Members are currently sitting on multiple double-digit gains while being paid generous dividends in all positions.
Now, let's look at this performance chart showing the Energy Select Sector SPDR (XLE), a basket of leading oil stocks, against the performance of the S&P 500:
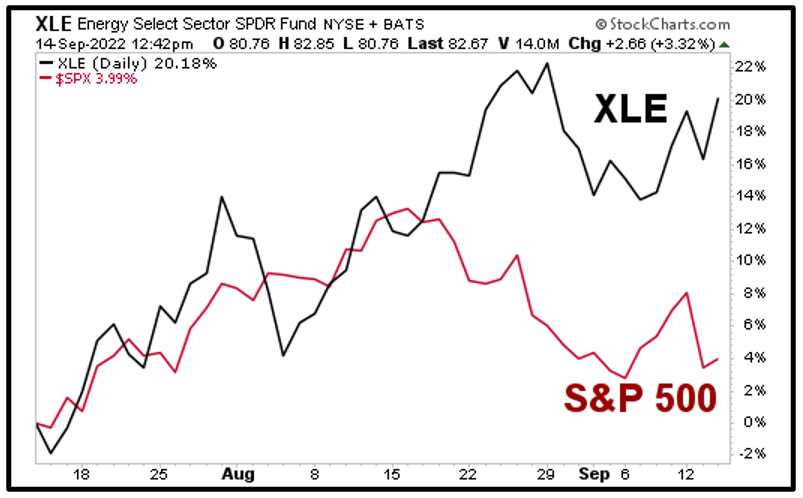
You can see that the S&P 500 is up just 3.99% since that bottom — it gave a lot of its gains back on Tuesday, when the CPI came out. But over the same time span, the XLE is up more than 20%, and that outperformance seems to be growing stronger.
Oil Shrugs Off "Bad" News
Here's another indication that oil is strong. On Wednesday, the International Energy Agency lowered its forecast for Chinese oil demand due to ongoing COVID-19 lockdowns. The IEA believes that will lower Chinese oil demand by 420,000 barrels per day (2.7%) this year.
I think the IEA is underestimating how much oil China is buying from Russia, but never mind that. The bad news should send oil prices down, right? Instead, oil prices rose 2.75% the very same day.
When a stock or commodity reacts bullishly to so-called bad news, that's usually a sign there's more bullishness ahead.
Now, let's look at a price chart of the XLE itself:

You can see that the XLE is coming back strong from that July low. It tested overhead resistance at $85.18 once, and I think it's going to do it again. A successful breakout there should take the XLE back to test its old high at $92.
The XLE is stuffed with plenty of big oil companies. It has an expense ratio of 0.10%, which is pretty cheap. Importantly, it sports a dividend yield of 3.41%. That's more than DOUBLE the dividend yield of 1.46%.
Studies have shown that in inflationary times, stocks that pay big dividends outperform. That makes sense. Investors are looking for yield. And they're finding it in energy stocks.
Something to consider if you're trying to ride out this wild and woolly market. Just make sure you're conducting your own due diligence beforehand.
All the best,
Sean