2 Key Signals Now Agree on Bitcoin’s Next Move

 |
| By Juan Villaverde |
Last week, I pointed out something that surprised a lot folks: Bitcoin (BTC) had stopped following liquidity and started following the bond market.
Let me give you the background.
Bitcoin normally takes its cues from two liquidity benchmarks: Japanese M2 (JpM2) and Central Bank Liquidity (CBL).
Both showed a top in early August. Followed by a correction into mid-October.
If Bitcoin had done what it usually does, it would have spent the last two months sliding lower.
But instead of going down, it went up!
It rallied, an action that followed not liquidity’s path, but the bond market. More precisely, it followed the price of the 10-year Treasury note, shifted forward by about 13 months.
That remains the case today.
Think of it as two navigation apps. For three months, one told Bitcoin to turn left and the other told it to turn right. Despite usually taking directions from liquidity, Bitcoin took the scenic route and got its directions from the bond market.
I have since studied the bond chart in more detail. And what I found is worth sharing.
Bitcoin Following Bonds
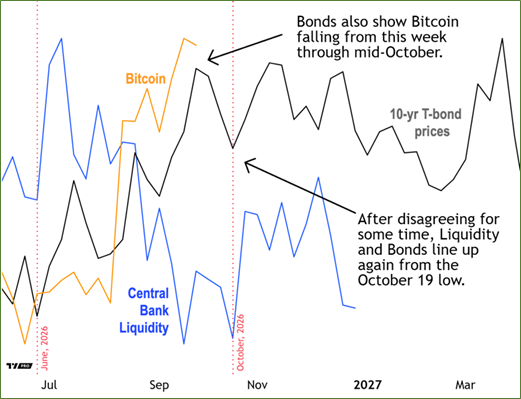
Where they disagreed: Bonds showed a top in late September while CBL showed the top in early August. As I’ve said, Bitcoin ignored liquidity and followed the bond market instead.
But now, both converge into a low on the exact same week: The chart above shows these on weekly charts, and both bottom the week of Oct. 19.
After three months of disagreeing, bonds and liquidity have realigned.
And the agreement doesn’t stop there. From that October low, both show a rally into early December. (Both indicate we should expect a mild one, but more on that in a moment.)
Then both show a top in early to mid-December, followed by another correction. How long does that correction last?
Well, the bond market says it runs into February 2027. Liquidity can’t say yet, because it can only see it through the end of December.
My own forecasting model shows the correction ending sooner, by mid-January at the latest.
Here’s the key point in all this …
- It no longer matters which leading indicator Bitcoin follows.
- Both call for a correction for the next two weeks into the week of Oct. 19.
- After that, both call for a rally into early December.
- And both call for another correction to wrap up 2026.
For the past three months, I had to tell you the outlook depended on which indicator Bitcoin chose. Now it doesn’t.
After a summer of mixed signals, I’ll take that.
There is one difference, however: Bonds and CBL show a modest rally into December, while JpM2 shows a strong one.
That’s the only disagreement I can see. And it’s about size, not timing.
Which brings me to a reminder: These are timing indicators. They don’t predict price.
They tell us when prices are likely to rise and fall, not by how much. That’s where my analysis comes in.
Read that way, all three say the same thing …
- A correction into the second half of October. I expect this to be mild, 10% to 15% at most for Bitcoin, a little more for altcoins.
- A rally into the first week of December. Though, as we know, cycles like to be balanced. A mild correction means this will likely be a mild rally. My target is we’ll see BTC near $90,000 by year end.
- Then one more correction before the bull cycle gets underway in earnest.
When will that correction end?
Like CBL, JpM2 doesn’t say. Both only allow us to see three months into the future. The red line stops in the last week of December, so I can’t see where the decline bottoms.
For that, I have two other sources: the bond market and my Forecasting Model.
The former points to mid-February. But my model suggests the low can come earlier, between Dec. 24 and Jan. 13.
We should be able to tighten this range as we get closer. And we’ll want to, since I believe that low will be one of the last good chances to load up for long-term investors now that we have confirmed the multi-year cycle has turned bullish.
Which is why my Crypto Timing Model is hard at work, scanning Bitcoin and the top altcoins for the moment they cross critical thresholds.
That’s what helps my Weiss Crypto Investor members find the best times to load up on their long-term crypto investments.
To see how it can do the same for you, click here.
Until then, the market looks overbought, so don’t be surprised when it stumbles.
Best,
Juan Villaverde